

5. The crude extract peaks from the bacterial expression can also
help to perform a secondary correction in addition to the
internal control peaks, since the intensities of those bacterial
protein peaks should be the same in the two electropherograms
to be compared. If one wishes to use the crude extract peaks as
a secondary correction option, a range excluding the normalization peak and the peak of interest should be defined. We have
noticed that the Y-axis superimposition can often be further
improved by applying this secondary correction (Fig. 8).
6. We keep track of binding strengths, intensities and positions of
the internal controls, intensities and positions of the PDZ
domains, range of the crude extract and its intensity, shift/
dilation coefficients in the X-axis, and correction factors when
applying the secondary correction. We store all these data in
CSV files and combine them in a unique Data Base using
SQLite3. We then retrieve the data by asking “specific queries”
and manage the large amount of data with the Pandas package
provided by Python.
7. All the concentrations in Eq. 2 are known except that of the
PBM. For this purpose, affinities of several PDZ domains for a
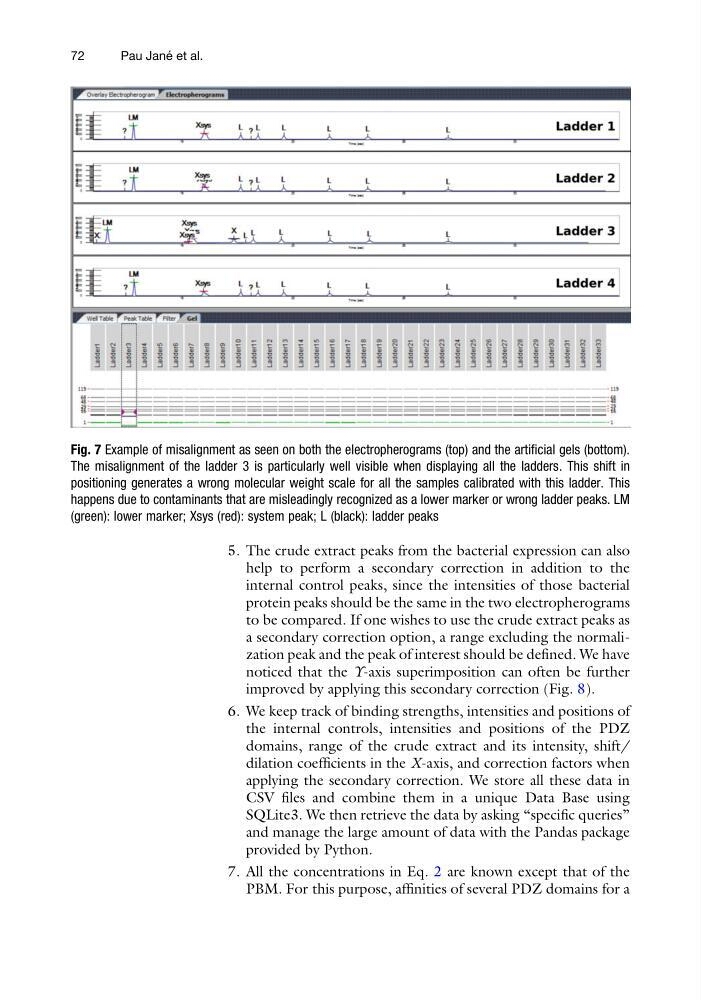
Fig. 7 Example of misalignment as seen on both the electropherograms (top) and the artificial gels (bottom).
The misalignment of the ladder 3 is particularly well visible when displaying all the ladders. This shift in
positioning generates a wrong molecular weight scale for all the samples calibrated with this ladder. This
happens due to contaminants that are misleadingly recognized as a lower marker or wrong ladder peaks. LM
(green): lower marker; Xsys (red): system peak; L (black): ladder peaks
72
Pau Jane ´ et al.
help to perform a secondary correction in addition to the
internal control peaks, since the intensities of those bacterial
protein peaks should be the same in the two electropherograms
to be compared. If one wishes to use the crude extract peaks as
a secondary correction option, a range excluding the normalization peak and the peak of interest should be defined. We have
noticed that the Y-axis superimposition can often be further
improved by applying this secondary correction (Fig. 8).
6. We keep track of binding strengths, intensities and positions of
the internal controls, intensities and positions of the PDZ
domains, range of the crude extract and its intensity, shift/
dilation coefficients in the X-axis, and correction factors when
applying the secondary correction. We store all these data in
CSV files and combine them in a unique Data Base using
SQLite3. We then retrieve the data by asking “specific queries”
and manage the large amount of data with the Pandas package
provided by Python.
7. All the concentrations in Eq. 2 are known except that of the
PBM. For this purpose, affinities of several PDZ domains for a
Fig. 7 Example of misalignment as seen on both the electropherograms (top) and the artificial gels (bottom).
The misalignment of the ladder 3 is particularly well visible when displaying all the ladders. This shift in
positioning generates a wrong molecular weight scale for all the samples calibrated with this ladder. This
happens due to contaminants that are misleadingly recognized as a lower marker or wrong ladder peaks. LM
(green): lower marker; Xsys (red): system peak; L (black): ladder peaks
72
Pau Jane ´ et al.