

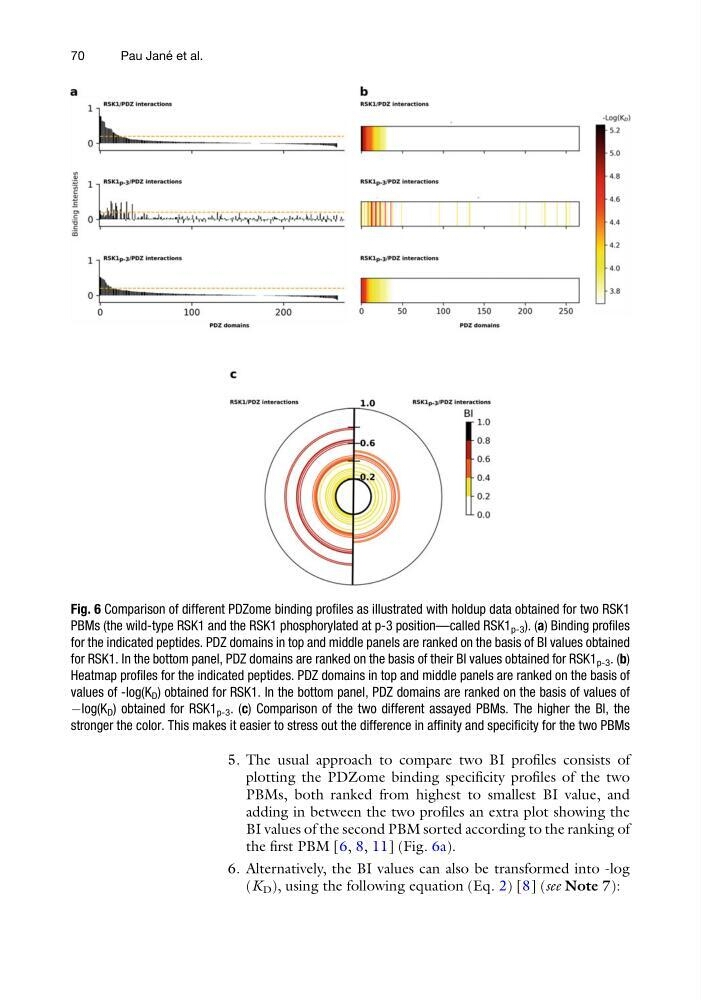
5. The usual approach to compare two BI profiles consists of
plotting the PDZome binding specificity profiles of the two
PBMs, both ranked from highest to smallest BI value, and
adding in between the two profiles an extra plot showing the
BI values of the second PBM sorted according to the ranking of
the first PBM [6, 8, 11] (Fig. 6a).
6. Alternatively, the BI values can also be transformed into -log
(K D ), using the following equation (Eq. 2) [8] (see Note 7):
Fig. 6 Comparison of different PDZome binding profiles as illustrated with holdup data obtained for two RSK1
PBMs (the wild-type RSK1 and the RSK1 phosphorylated at p-3 position—called RSK1 p-3 ). (a) Binding profiles
for the indicated peptides. PDZ domains in top and middle panels are ranked on the basis of BI values obtained
for RSK1. In the bottom panel, PDZ domains are ranked on the basis of their BI values obtained for RSK1 p-3 . (b)
Heatmap profiles for the indicated peptides. PDZ domains in top and middle panels are ranked on the basis of
values of -log(K D ) obtained for RSK1. In the bottom panel, PDZ domains are ranked on the basis of values of
Àlog(K D ) obtained for RSK1 p-3 . (c) Comparison of the two different assayed PBMs. The higher the BI, the
stronger the color. This makes it easier to stress out the difference in affinity and specificity for the two PBMs
70
Pau Jane ´ et al.
plotting the PDZome binding specificity profiles of the two
PBMs, both ranked from highest to smallest BI value, and
adding in between the two profiles an extra plot showing the
BI values of the second PBM sorted according to the ranking of
the first PBM [6, 8, 11] (Fig. 6a).
6. Alternatively, the BI values can also be transformed into -log
(K D ), using the following equation (Eq. 2) [8] (see Note 7):
Fig. 6 Comparison of different PDZome binding profiles as illustrated with holdup data obtained for two RSK1
PBMs (the wild-type RSK1 and the RSK1 phosphorylated at p-3 position—called RSK1 p-3 ). (a) Binding profiles
for the indicated peptides. PDZ domains in top and middle panels are ranked on the basis of BI values obtained
for RSK1. In the bottom panel, PDZ domains are ranked on the basis of their BI values obtained for RSK1 p-3 . (b)
Heatmap profiles for the indicated peptides. PDZ domains in top and middle panels are ranked on the basis of
values of -log(K D ) obtained for RSK1. In the bottom panel, PDZ domains are ranked on the basis of values of
Àlog(K D ) obtained for RSK1 p-3 . (c) Comparison of the two different assayed PBMs. The higher the BI, the
stronger the color. This makes it easier to stress out the difference in affinity and specificity for the two PBMs
70
Pau Jane ´ et al.