

3.3 Checking
the Data Quality
In order to assay the overall quality of the electropherograms, we
determined empirically several quality criteria that can be fulfilled:
1. Quality of the normalization peak: The intensity of the normalization peak should be in the same order of magnitude as for
the PDZ peak observed in the reference.
2. Quality of the detection signal: Both normalization and PDZ
peaks should be in the linear range of the capillary electrophoresis instrument.
3. Quality of the PDZ expression: The ratio of the PDZ intensity
by the average of signal within the crude extract range (typically
20–50 kDa) should be as high as possible, and never below 1.5.
4. Quality of the PDZ construct dilution: We experimentally
observed a threshold intensity of the PDZ peak (~200 units
of Fluorescence) below which the processing might be critical.
5. Quality of the PDZ construct: The difference between experimental (from Caliper data after conversion) and theoretical
(according to the sequence of the construct) molecular weights
should be as low as possible, and not exceed 5 kDa (see
Note 4).
6. Quality of the electropherogram superimposition on X-axis:
The linear transformation used to match the X-axis of the two
electropherograms should be as neutral as possible (i.e., dilation coefficient and shift as close as possible to 1.0 and 0.0,
respectively).
7. Quality of the electropherogram comparison on Y-axis: It is
also possible to improve the accuracy of the signal comparison
when the overexpressed sample is not purified and contains
peaks from the bacterial crude extract (see Note 5). If used,
this optional processing step should lead to a correction factor
as close to 1.00 as possible.
3.4 Extracting BIs
and Other Data
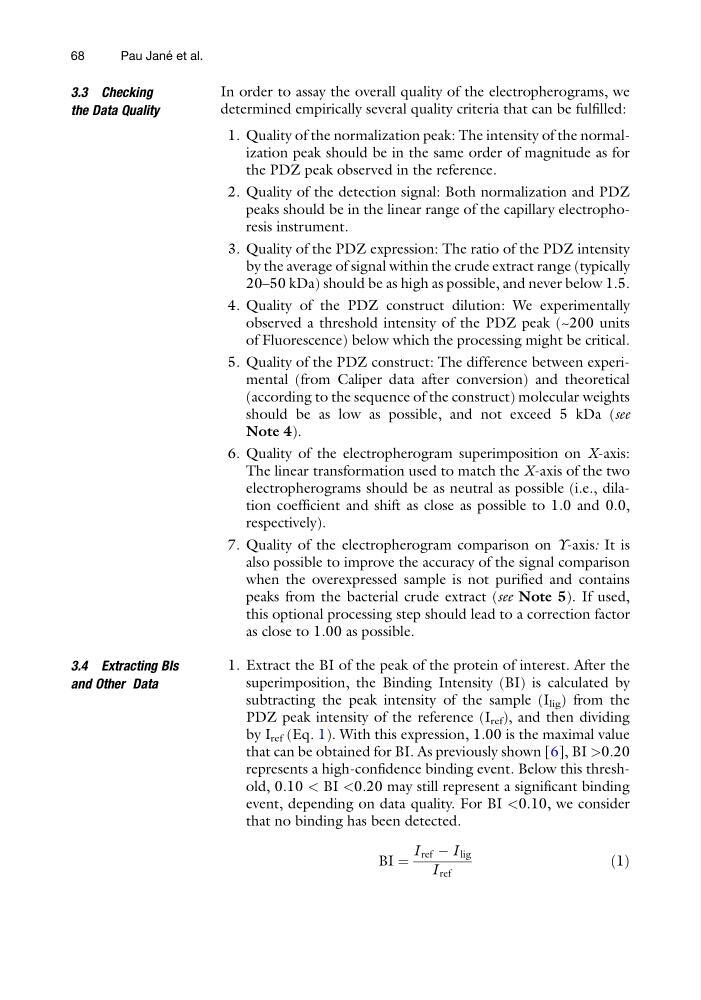
1. Extract the BI of the peak of the protein of interest. After the
superimposition, the Binding Intensity (BI) is calculated by
subtracting the peak intensity of the sample (I lig ) from the
PDZ peak intensity of the reference (I ref ), and then dividing
by I ref (Eq. 1). With this expression, 1.00 is the maximal value
that can be obtained for BI. As previously shown [6], BI >0.20
represents a high-confidence binding event. Below this threshold, 0.10 < BI <0.20 may still represent a significant binding
event, depending on data quality. For BI <0.10, we consider
that no binding has been detected.
BI ¼
I ref À I lig
I ref
ð1Þ
68
Pau Jane ´ et al.
the Data Quality
In order to assay the overall quality of the electropherograms, we
determined empirically several quality criteria that can be fulfilled:
1. Quality of the normalization peak: The intensity of the normalization peak should be in the same order of magnitude as for
the PDZ peak observed in the reference.
2. Quality of the detection signal: Both normalization and PDZ
peaks should be in the linear range of the capillary electrophoresis instrument.
3. Quality of the PDZ expression: The ratio of the PDZ intensity
by the average of signal within the crude extract range (typically
20–50 kDa) should be as high as possible, and never below 1.5.
4. Quality of the PDZ construct dilution: We experimentally
observed a threshold intensity of the PDZ peak (~200 units
of Fluorescence) below which the processing might be critical.
5. Quality of the PDZ construct: The difference between experimental (from Caliper data after conversion) and theoretical
(according to the sequence of the construct) molecular weights
should be as low as possible, and not exceed 5 kDa (see
Note 4).
6. Quality of the electropherogram superimposition on X-axis:
The linear transformation used to match the X-axis of the two
electropherograms should be as neutral as possible (i.e., dilation coefficient and shift as close as possible to 1.0 and 0.0,
respectively).
7. Quality of the electropherogram comparison on Y-axis: It is
also possible to improve the accuracy of the signal comparison
when the overexpressed sample is not purified and contains
peaks from the bacterial crude extract (see Note 5). If used,
this optional processing step should lead to a correction factor
as close to 1.00 as possible.
3.4 Extracting BIs
and Other Data
1. Extract the BI of the peak of the protein of interest. After the
superimposition, the Binding Intensity (BI) is calculated by
subtracting the peak intensity of the sample (I lig ) from the
PDZ peak intensity of the reference (I ref ), and then dividing
by I ref (Eq. 1). With this expression, 1.00 is the maximal value
that can be obtained for BI. As previously shown [6], BI >0.20
represents a high-confidence binding event. Below this threshold, 0.10 < BI <0.20 may still represent a significant binding
event, depending on data quality. For BI <0.10, we consider
that no binding has been detected.
BI ¼
I ref À I lig
I ref
ð1Þ
68
Pau Jane ´ et al.