

4. Adjust the X-axis of the sample electropherogram to better
match the reference electropherogram using a linear transformation (shift and dilation/contraction). For this purpose, the
difference of signal between the two electropherograms is
minimized using a least square approach by focusing on a
molecular weight window that contains the peak of the protein
of interest.
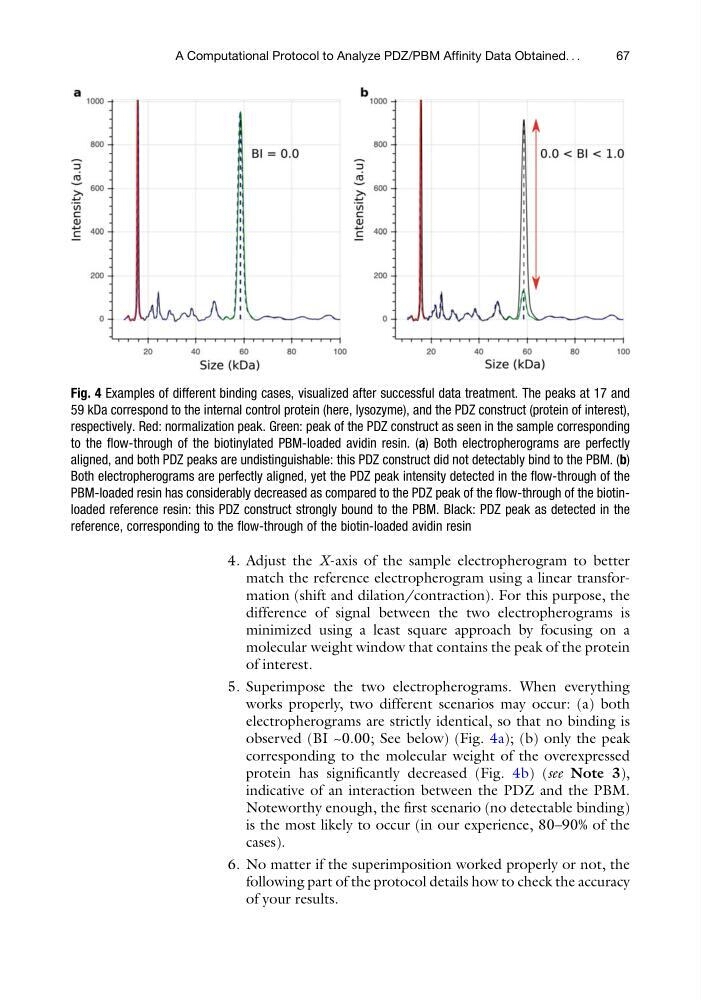
5. Superimpose the two electropherograms. When everything
works properly, two different scenarios may occur: (a) both
electropherograms are strictly identical, so that no binding is
observed (BI ~0.00; See below) (Fig. 4a); (b) only the peak
corresponding to the molecular weight of the overexpressed
protein has significantly decreased (Fig. 4b) (see Note 3),
indicative of an interaction between the PDZ and the PBM.
Noteworthy enough, the first scenario (no detectable binding)
is the most likely to occur (in our experience, 80–90% of the
cases).
6. No matter if the superimposition worked properly or not, the
following part of the protocol details how to check the accuracy
of your results.
Fig. 4 Examples of different binding cases, visualized after successful data treatment. The peaks at 17 and
59 kDa correspond to the internal control protein (here, lysozyme), and the PDZ construct (protein of interest),
respectively. Red: normalization peak. Green: peak of the PDZ construct as seen in the sample corresponding
to the flow-through of the biotinylated PBM-loaded avidin resin. (a) Both electropherograms are perfectly
aligned, and both PDZ peaks are undistinguishable: this PDZ construct did not detectably bind to the PBM. (b)
Both electropherograms are perfectly aligned, yet the PDZ peak intensity detected in the flow-through of the
PBM-loaded resin has considerably decreased as compared to the PDZ peak of the flow-through of the biotinloaded reference resin: this PDZ construct strongly bound to the PBM. Black: PDZ peak as detected in the
reference, corresponding to the flow-through of the biotin-loaded avidin resin
A Computational Protocol to Analyze PDZ/PBM Affinity Data Obtained. . .
67
match the reference electropherogram using a linear transformation (shift and dilation/contraction). For this purpose, the
difference of signal between the two electropherograms is
minimized using a least square approach by focusing on a
molecular weight window that contains the peak of the protein
of interest.
5. Superimpose the two electropherograms. When everything
works properly, two different scenarios may occur: (a) both
electropherograms are strictly identical, so that no binding is
observed (BI ~0.00; See below) (Fig. 4a); (b) only the peak
corresponding to the molecular weight of the overexpressed
protein has significantly decreased (Fig. 4b) (see Note 3),
indicative of an interaction between the PDZ and the PBM.
Noteworthy enough, the first scenario (no detectable binding)
is the most likely to occur (in our experience, 80–90% of the
cases).
6. No matter if the superimposition worked properly or not, the
following part of the protocol details how to check the accuracy
of your results.
Fig. 4 Examples of different binding cases, visualized after successful data treatment. The peaks at 17 and
59 kDa correspond to the internal control protein (here, lysozyme), and the PDZ construct (protein of interest),
respectively. Red: normalization peak. Green: peak of the PDZ construct as seen in the sample corresponding
to the flow-through of the biotinylated PBM-loaded avidin resin. (a) Both electropherograms are perfectly
aligned, and both PDZ peaks are undistinguishable: this PDZ construct did not detectably bind to the PBM. (b)
Both electropherograms are perfectly aligned, yet the PDZ peak intensity detected in the flow-through of the
PBM-loaded resin has considerably decreased as compared to the PDZ peak of the flow-through of the biotinloaded reference resin: this PDZ construct strongly bound to the PBM. Black: PDZ peak as detected in the
reference, corresponding to the flow-through of the biotin-loaded avidin resin
A Computational Protocol to Analyze PDZ/PBM Affinity Data Obtained. . .
67