

3.2 Transforming
the Input Data
1. Among other information, the extracted raw data files contain
three columns with migration time, converted molecular
weights, and fluorescence signal. Adjust their format to make
them easy to read in order to manage the data for the following
steps. A full access to the data allows to plot them. In particular,
it is possible to replot the results of each individual in order to
give a better understanding of the process and to detect any
problem that would occur during the procedure.
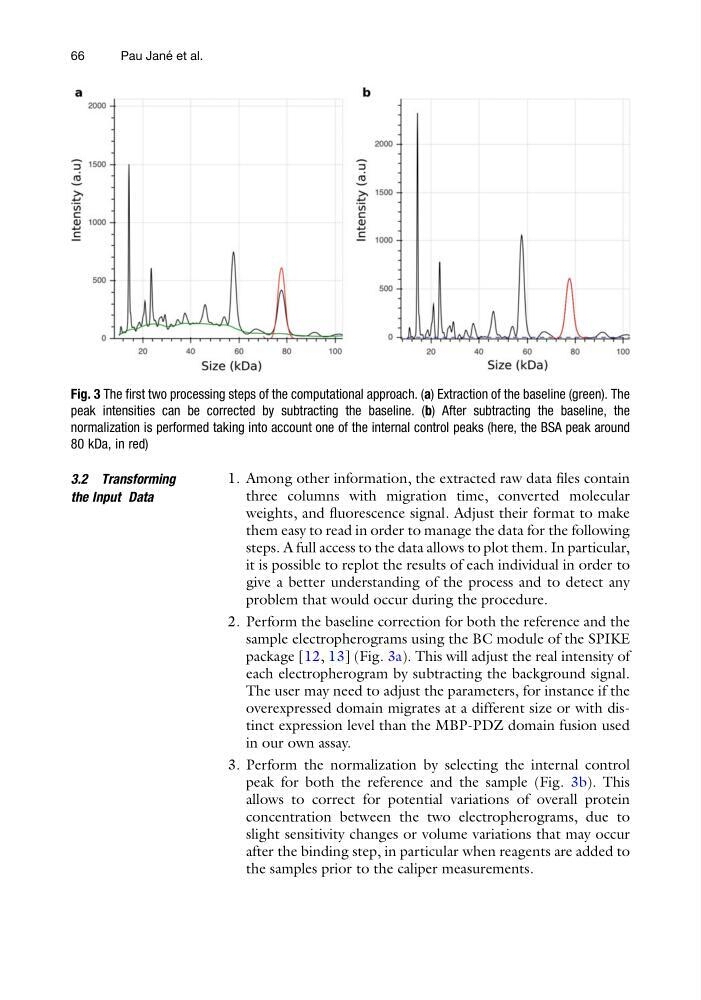
2. Perform the baseline correction for both the reference and the
sample electropherograms using the BC module of the SPIKE
package [12, 13] (Fig. 3a). This will adjust the real intensity of
each electropherogram by subtracting the background signal.
The user may need to adjust the parameters, for instance if the
overexpressed domain migrates at a different size or with distinct expression level than the MBP-PDZ domain fusion used
in our own assay.
3. Perform the normalization by selecting the internal control
peak for both the reference and the sample (Fig. 3b). This
allows to correct for potential variations of overall protein
concentration between the two electropherograms, due to
slight sensitivity changes or volume variations that may occur
after the binding step, in particular when reagents are added to
the samples prior to the caliper measurements.
Fig. 3 The first two processing steps of the computational approach. (a) Extraction of the baseline (green). The
peak intensities can be corrected by subtracting the baseline. (b) After subtracting the baseline, the
normalization is performed taking into account one of the internal control peaks (here, the BSA peak around
80 kDa, in red)
66
Pau Jane ´ et al.
the Input Data
1. Among other information, the extracted raw data files contain
three columns with migration time, converted molecular
weights, and fluorescence signal. Adjust their format to make
them easy to read in order to manage the data for the following
steps. A full access to the data allows to plot them. In particular,
it is possible to replot the results of each individual in order to
give a better understanding of the process and to detect any
problem that would occur during the procedure.
2. Perform the baseline correction for both the reference and the
sample electropherograms using the BC module of the SPIKE
package [12, 13] (Fig. 3a). This will adjust the real intensity of
each electropherogram by subtracting the background signal.
The user may need to adjust the parameters, for instance if the
overexpressed domain migrates at a different size or with distinct expression level than the MBP-PDZ domain fusion used
in our own assay.
3. Perform the normalization by selecting the internal control
peak for both the reference and the sample (Fig. 3b). This
allows to correct for potential variations of overall protein
concentration between the two electropherograms, due to
slight sensitivity changes or volume variations that may occur
after the binding step, in particular when reagents are added to
the samples prior to the caliper measurements.
Fig. 3 The first two processing steps of the computational approach. (a) Extraction of the baseline (green). The
peak intensities can be corrected by subtracting the baseline. (b) After subtracting the baseline, the
normalization is performed taking into account one of the internal control peaks (here, the BSA peak around
80 kDa, in red)
66
Pau Jane ´ et al.