

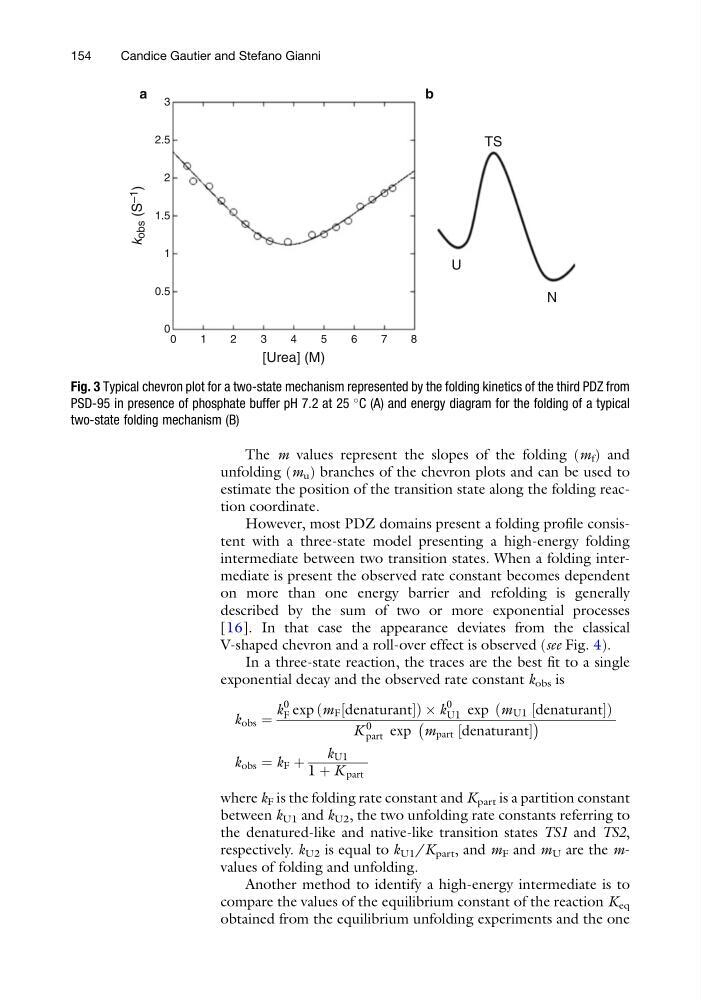
The m values represent the slopes of the folding (m f ) and
unfolding (m u ) branches of the chevron plots and can be used to
estimate the position of the transition state along the folding reaction coordinate.
However, most PDZ domains present a folding profile consistent with a three-state model presenting a high-energy folding
intermediate between two transition states. When a folding intermediate is present the observed rate constant becomes dependent
on more than one energy barrier and refolding is generally
described by the sum of two or more exponential processes
[16]. In that case the appearance deviates from the classical
V-shaped chevron and a roll-over effect is observed (see Fig. 4).
In a three-state reaction, the traces are the best fit to a single
exponential decay and the observed rate constant k obs is
k obs ¼
k
0
F exp m F denaturant
½
ð
Þ Â k
0
U1 exp m U1 denaturant
½
ð
Þ
K
0
part exp m part denaturant
½
À
Á
k obs ¼ k F þ
k U1
1 þ K part
where k F is the folding rate constant and K part is a partition constant
between k U1 and k U2 , the two unfolding rate constants referring to
the denatured-like and native-like transition states TS1 and TS2,
respectively. k U2 is equal to k U1 /K part , and m F and m U are the mvalues of folding and unfolding.
Another method to identify a high-energy intermediate is to
compare the values of the equilibrium constant of the reaction K eq
obtained from the equilibrium unfolding experiments and the one
a
b
2.5
3
1.5
0.5
0
1
2
0
1
2
3
4
5
6
7
TS
U
N
8
[Urea] (M)
k
obs (S –1
)
Fig. 3 Typical chevron plot for a two-state mechanism represented by the folding kinetics of the third PDZ from
PSD-95 in presence of phosphate buffer pH 7.2 at 25
C (A) and energy diagram for the folding of a typical
two-state folding mechanism (B)
154
Candice Gautier and Stefano Gianni
unfolding (m u ) branches of the chevron plots and can be used to
estimate the position of the transition state along the folding reaction coordinate.
However, most PDZ domains present a folding profile consistent with a three-state model presenting a high-energy folding
intermediate between two transition states. When a folding intermediate is present the observed rate constant becomes dependent
on more than one energy barrier and refolding is generally
described by the sum of two or more exponential processes
[16]. In that case the appearance deviates from the classical
V-shaped chevron and a roll-over effect is observed (see Fig. 4).
In a three-state reaction, the traces are the best fit to a single
exponential decay and the observed rate constant k obs is
k obs ¼
k
0
F exp m F denaturant
½
ð
Þ Â k
0
U1 exp m U1 denaturant
½
ð
Þ
K
0
part exp m part denaturant
½
À
Á
k obs ¼ k F þ
k U1
1 þ K part
where k F is the folding rate constant and K part is a partition constant
between k U1 and k U2 , the two unfolding rate constants referring to
the denatured-like and native-like transition states TS1 and TS2,
respectively. k U2 is equal to k U1 /K part , and m F and m U are the mvalues of folding and unfolding.
Another method to identify a high-energy intermediate is to
compare the values of the equilibrium constant of the reaction K eq
obtained from the equilibrium unfolding experiments and the one
a
b
2.5
3
1.5
0.5
0
1
2
0
1
2
3
4
5
6
7
TS
U
N
8
[Urea] (M)
k
obs (S –1
)
Fig. 3 Typical chevron plot for a two-state mechanism represented by the folding kinetics of the third PDZ from
PSD-95 in presence of phosphate buffer pH 7.2 at 25
C (A) and energy diagram for the folding of a typical
two-state folding mechanism (B)
154
Candice Gautier and Stefano Gianni