

1. The reaction is made by rapidly mixing the unfolded protein
into a buffer that is suitable for folding (folding studies) and
vice versa by rapidly mixing the folded protein into a denaturant buffer (unfolding studies). Experimentally, these studies are
made using a stopped-flow device with pressure-driven syringes
pushing the two solutions to a mixing chamber in which the
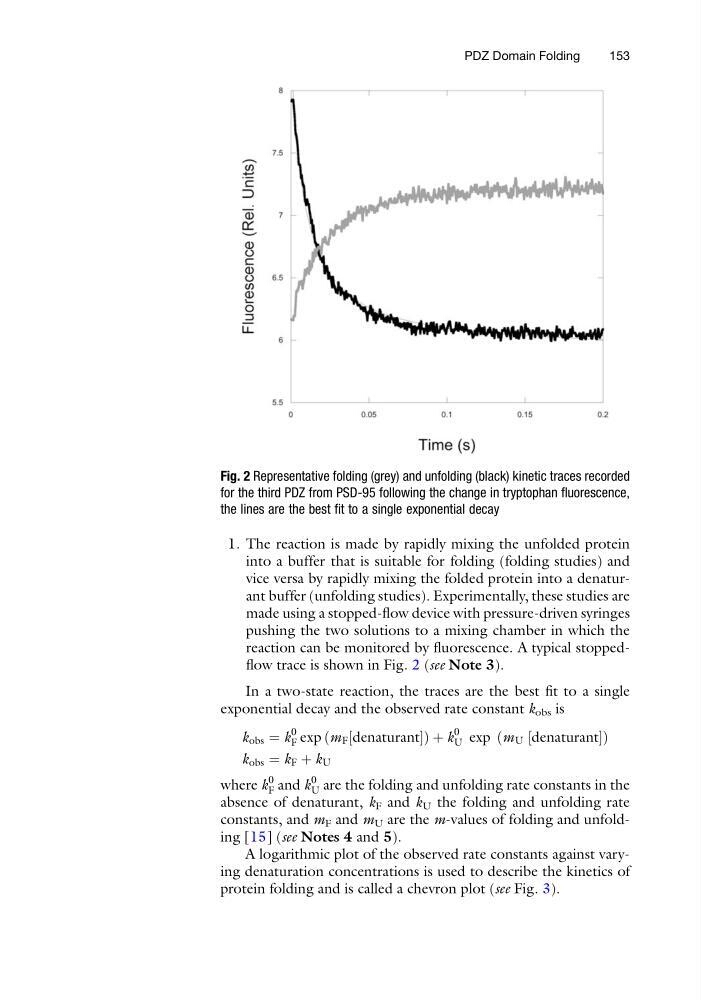
reaction can be monitored by fluorescence. A typical stoppedflow trace is shown in Fig. 2 (see Note 3).
In a two-state reaction, the traces are the best fit to a single
exponential decay and the observed rate constant k obs is
k obs ¼ k
0
F exp m F denaturant
½
ð
Þ þ k
0
U exp m U denaturant
½
ð
Þ
k obs ¼ k F þ k U
where k
0
F and k
0
U are the folding and unfolding rate constants in the
absence of denaturant, k F and k U the folding and unfolding rate
constants, and m F and m U are the m-values of folding and unfolding [15] (see Notes 4 and 5).
A logarithmic plot of the observed rate constants against varying denaturation concentrations is used to describe the kinetics of
protein folding and is called a chevron plot (see Fig. 3).
Fig. 2 Representative folding (grey) and unfolding (black) kinetic traces recorded
for the third PDZ from PSD-95 following the change in tryptophan fluorescence,
the lines are the best fit to a single exponential decay
PDZ Domain Folding
153
into a buffer that is suitable for folding (folding studies) and
vice versa by rapidly mixing the folded protein into a denaturant buffer (unfolding studies). Experimentally, these studies are
made using a stopped-flow device with pressure-driven syringes
pushing the two solutions to a mixing chamber in which the
reaction can be monitored by fluorescence. A typical stoppedflow trace is shown in Fig. 2 (see Note 3).
In a two-state reaction, the traces are the best fit to a single
exponential decay and the observed rate constant k obs is
k obs ¼ k
0
F exp m F denaturant
½
ð
Þ þ k
0
U exp m U denaturant
½
ð
Þ
k obs ¼ k F þ k U
where k
0
F and k
0
U are the folding and unfolding rate constants in the
absence of denaturant, k F and k U the folding and unfolding rate
constants, and m F and m U are the m-values of folding and unfolding [15] (see Notes 4 and 5).
A logarithmic plot of the observed rate constants against varying denaturation concentrations is used to describe the kinetics of
protein folding and is called a chevron plot (see Fig. 3).
Fig. 2 Representative folding (grey) and unfolding (black) kinetic traces recorded
for the third PDZ from PSD-95 following the change in tryptophan fluorescence,
the lines are the best fit to a single exponential decay
PDZ Domain Folding
153