

domain ([PDZ] stock ) (i.e.,
tot V n ¼
tot V n-1 +
added
V stock summed
over n titration steps). This calculation can be conveniently
performed in spreadsheet software (e.g., Microsoft Excel).
3. Baseline correction: The anisotropy value of the first data point
(A 1 at [PDZ] 1 ¼ 0) is subtracted from the anisotropy value of
each subsequent data point (A n at [PDZ] n ) to obtain the
corrected anisotropy at each PDZ concentration (
corr A n ¼ A n
- A 1 ). Figure 2 shows an example of processed data computed
in a spreadsheet program.
3.5 Data Analysis
and Binding Curve
Presentation
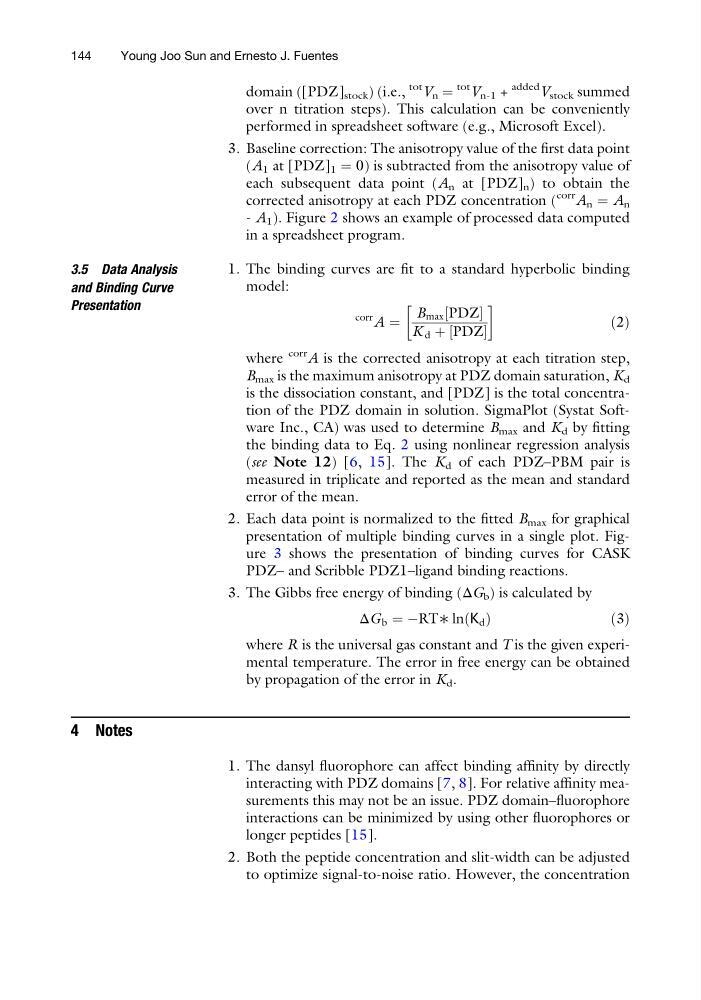
1. The binding curves are fit to a standard hyperbolic binding
model:
corr A ¼
B max PDZ
½
K d þ PDZ
½
!
ð2Þ
where
corr
A is the corrected anisotropy at each titration step,
B max is the maximum anisotropy at PDZ domain saturation, K d
is the dissociation constant, and [PDZ] is the total concentration of the PDZ domain in solution. SigmaPlot (Systat Software Inc., CA) was used to determine B max and K d by fitting
the binding data to Eq. 2 using nonlinear regression analysis
(see Note 12) [6, 15]. The K d of each PDZ–PBM pair is
measured in triplicate and reported as the mean and standard
error of the mean.
2. Each data point is normalized to the fitted B max for graphical
presentation of multiple binding curves in a single plot. Figure 3 shows the presentation of binding curves for CASK
PDZ– and Scribble PDZ1–ligand binding reactions.
3. The Gibbs free energy of binding (ΔG b ) is calculated by
ΔG b ¼ ÀRT∗ ln K d
ð Þ
ð3Þ
where R is the universal gas constant and T is the given experimental temperature. The error in free energy can be obtained
by propagation of the error in K d .
4 Notes
1. The dansyl fluorophore can affect binding affinity by directly
interacting with PDZ domains [7, 8]. For relative affinity measurements this may not be an issue. PDZ domain–fluorophore
interactions can be minimized by using other fluorophores or
longer peptides [15].
2. Both the peptide concentration and slit-width can be adjusted
to optimize signal-to-noise ratio. However, the concentration
144
Young Joo Sun and Ernesto J. Fuentes
tot V n ¼
tot V n-1 +
added
V stock summed
over n titration steps). This calculation can be conveniently
performed in spreadsheet software (e.g., Microsoft Excel).
3. Baseline correction: The anisotropy value of the first data point
(A 1 at [PDZ] 1 ¼ 0) is subtracted from the anisotropy value of
each subsequent data point (A n at [PDZ] n ) to obtain the
corrected anisotropy at each PDZ concentration (
corr A n ¼ A n
- A 1 ). Figure 2 shows an example of processed data computed
in a spreadsheet program.
3.5 Data Analysis
and Binding Curve
Presentation
1. The binding curves are fit to a standard hyperbolic binding
model:
corr A ¼
B max PDZ
½
K d þ PDZ
½
!
ð2Þ
where
corr
A is the corrected anisotropy at each titration step,
B max is the maximum anisotropy at PDZ domain saturation, K d
is the dissociation constant, and [PDZ] is the total concentration of the PDZ domain in solution. SigmaPlot (Systat Software Inc., CA) was used to determine B max and K d by fitting
the binding data to Eq. 2 using nonlinear regression analysis
(see Note 12) [6, 15]. The K d of each PDZ–PBM pair is
measured in triplicate and reported as the mean and standard
error of the mean.
2. Each data point is normalized to the fitted B max for graphical
presentation of multiple binding curves in a single plot. Figure 3 shows the presentation of binding curves for CASK
PDZ– and Scribble PDZ1–ligand binding reactions.
3. The Gibbs free energy of binding (ΔG b ) is calculated by
ΔG b ¼ ÀRT∗ ln K d
ð Þ
ð3Þ
where R is the universal gas constant and T is the given experimental temperature. The error in free energy can be obtained
by propagation of the error in K d .
4 Notes
1. The dansyl fluorophore can affect binding affinity by directly
interacting with PDZ domains [7, 8]. For relative affinity measurements this may not be an issue. PDZ domain–fluorophore
interactions can be minimized by using other fluorophores or
longer peptides [15].
2. Both the peptide concentration and slit-width can be adjusted
to optimize signal-to-noise ratio. However, the concentration
144
Young Joo Sun and Ernesto J. Fuentes