

2. The equation for calculating the PDZ concentration at [PDZ] n
data point is.
PDZ
½
n ¼ PDZ
½
nÀ1 Â
tot V nÀ1
À
Á þ PDZ
½
stock Â
added V stock
À
Á
À
Á
=
tot V n
ð1Þ
where
tot V n is the total volume added over n titration steps,
tot V n-1 is total volume of PDZ protein added at the n -1 titration
point, and
added
V stock is the volume added of stock PDZ
PDZ
PBM
Dataset #
CASK PDZ
SDC1
2
Stock Conc. (µM) Added Vol. (µL) Total Vol. (µL)
Conc. (µM)
Anisotropy
Base line corr.
0.00
0
1300
0.00
0.02798
0.00000
12.29
3
1303
0.03
0.03079
0.00281
12.29
3
1306
0.06
0.02941
0.00143
12.29
5
1311
0.10
0.03041
0.00243
12.29
5
1316
0.15
0.02941
0.00143
12.29
10
1326
0.24
0.03037
0.00239
122.9
5
1331
0.70
0.02993
0.00195
122.9
5
1336
1.16
0.02853
0.00055
1229
3
1339
3.91
0.02696
-0.00102
1229
3
1342
6.65
0.03148
0.00350
1229
5
1347
11.19
0.03043
0.00245
1229
5
1352
15.69
0.03221
0.00423
1229
10
1362
24.60
0.03707
0.00909
1229
10
1372
33.38
0.03854
0.01056
1229
20
1392
50.55
0.04198
0.01400
1229
20
1412
67.25
0.04385
0.01587
1229
20
1432
83.47
0.04766
0.01969
1229
20
1452
99.25
0.05292
0.02494
1229
20
1472
114.60
0.05184
0.02386
1229
20
1492
129.54
0.05391
0.02593
1229
20
1512
144.08
0.05279
0.02481
1229
60
1572
185.49
0.05895
0.03097
1229
60
1632
223.86
0.05972
0.03174
1229
60
1692
259.50
0.06396
0.03598
1229
60
1752
292.70
0.06525
0.03727
1229
60
1812
323.70
0.06689
0.03891
1229
60
1872
352.72
0.06948
0.04150
1229
60
1932
379.93
0.07127
0.04329
1229
60
1992
405.51
0.07036
0.04238
1229
60
2052
429.59
0.07239
0.04441
Protein Concentration (µM)
1229
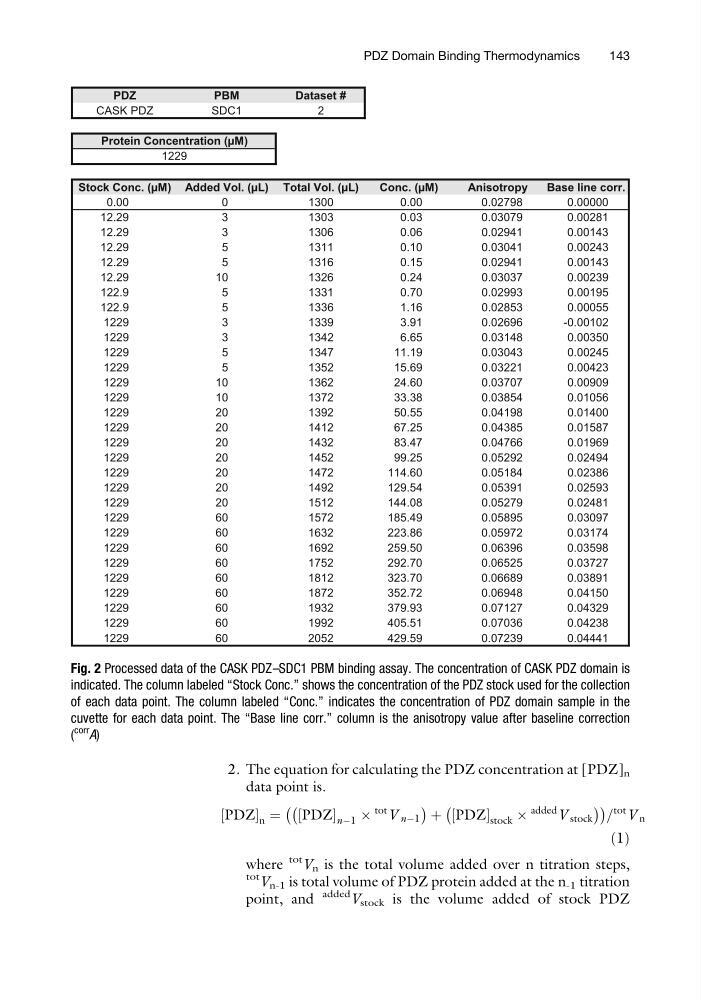
Fig. 2 Processed data of the CASK PDZ–SDC1 PBM binding assay. The concentration of CASK PDZ domain is
indicated. The column labeled “Stock Conc.” shows the concentration of the PDZ stock used for the collection
of each data point. The column labeled “Conc.” indicates the concentration of PDZ domain sample in the
cuvette for each data point. The “Base line corr.” column is the anisotropy value after baseline correction
(
corr A)
PDZ Domain Binding Thermodynamics
143
data point is.
PDZ
½
n ¼ PDZ
½
nÀ1 Â
tot V nÀ1
À
Á þ PDZ
½
stock Â
added V stock
À
Á
À
Á
=
tot V n
ð1Þ
where
tot V n is the total volume added over n titration steps,
tot V n-1 is total volume of PDZ protein added at the n -1 titration
point, and
added
V stock is the volume added of stock PDZ
PDZ
PBM
Dataset #
CASK PDZ
SDC1
2
Stock Conc. (µM) Added Vol. (µL) Total Vol. (µL)
Conc. (µM)
Anisotropy
Base line corr.
0.00
0
1300
0.00
0.02798
0.00000
12.29
3
1303
0.03
0.03079
0.00281
12.29
3
1306
0.06
0.02941
0.00143
12.29
5
1311
0.10
0.03041
0.00243
12.29
5
1316
0.15
0.02941
0.00143
12.29
10
1326
0.24
0.03037
0.00239
122.9
5
1331
0.70
0.02993
0.00195
122.9
5
1336
1.16
0.02853
0.00055
1229
3
1339
3.91
0.02696
-0.00102
1229
3
1342
6.65
0.03148
0.00350
1229
5
1347
11.19
0.03043
0.00245
1229
5
1352
15.69
0.03221
0.00423
1229
10
1362
24.60
0.03707
0.00909
1229
10
1372
33.38
0.03854
0.01056
1229
20
1392
50.55
0.04198
0.01400
1229
20
1412
67.25
0.04385
0.01587
1229
20
1432
83.47
0.04766
0.01969
1229
20
1452
99.25
0.05292
0.02494
1229
20
1472
114.60
0.05184
0.02386
1229
20
1492
129.54
0.05391
0.02593
1229
20
1512
144.08
0.05279
0.02481
1229
60
1572
185.49
0.05895
0.03097
1229
60
1632
223.86
0.05972
0.03174
1229
60
1692
259.50
0.06396
0.03598
1229
60
1752
292.70
0.06525
0.03727
1229
60
1812
323.70
0.06689
0.03891
1229
60
1872
352.72
0.06948
0.04150
1229
60
1932
379.93
0.07127
0.04329
1229
60
1992
405.51
0.07036
0.04238
1229
60
2052
429.59
0.07239
0.04441
Protein Concentration (µM)
1229
Fig. 2 Processed data of the CASK PDZ–SDC1 PBM binding assay. The concentration of CASK PDZ domain is
indicated. The column labeled “Stock Conc.” shows the concentration of the PDZ stock used for the collection
of each data point. The column labeled “Conc.” indicates the concentration of PDZ domain sample in the
cuvette for each data point. The “Base line corr.” column is the anisotropy value after baseline correction
(
corr A)
PDZ Domain Binding Thermodynamics
143