

0.1 to 3 mg/ml. Data can be analyzed with SEDFIT or Ultrascan
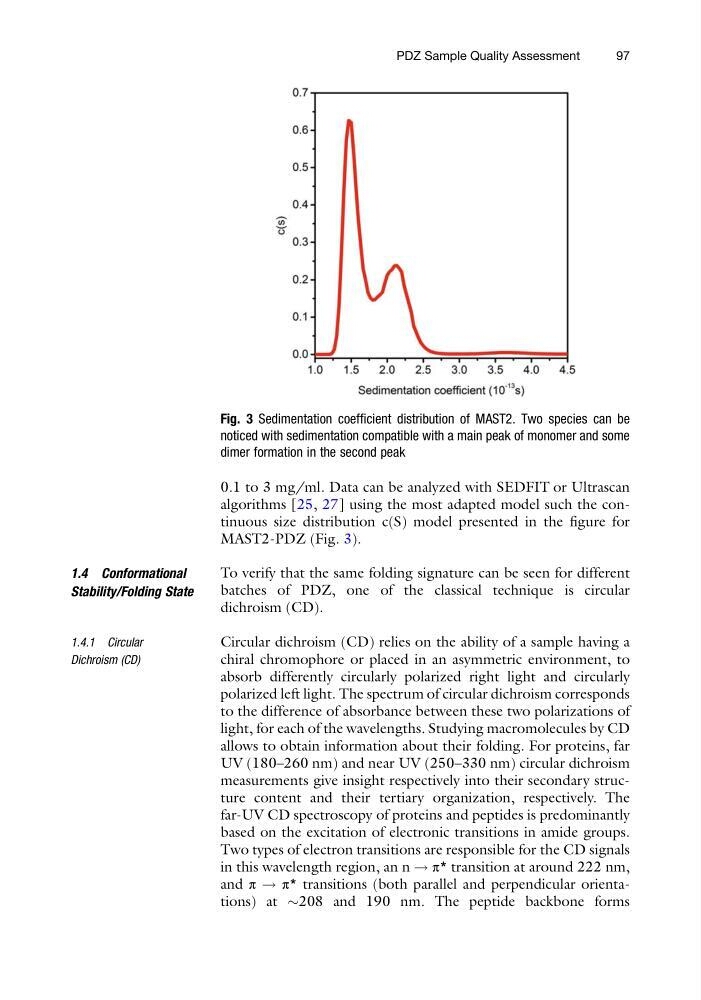
algorithms [25, 27] using the most adapted model such the continuous size distribution c(S) model presented in the figure for
MAST2-PDZ (Fig. 3).
1.4 Conformational
Stability/Folding State
To verify that the same folding signature can be seen for different
batches of PDZ, one of the classical technique is circular
dichroism (CD).
1.4.1 Circular
Dichroism (CD)
Circular dichroism (CD) relies on the ability of a sample having a
chiral chromophore or placed in an asymmetric environment, to
absorb differently circularly polarized right light and circularly
polarized left light. The spectrum of circular dichroism corresponds
to the difference of absorbance between these two polarizations of
light, for each of the wavelengths. Studying macromolecules by CD
allows to obtain information about their folding. For proteins, far
UV (180–260 nm) and near UV (250–330 nm) circular dichroism
measurements give insight respectively into their secondary structure content and their tertiary organization, respectively. The
far-UV CD spectroscopy of proteins and peptides is predominantly
based on the excitation of electronic transitions in amide groups.
Two types of electron transitions are responsible for the CD signals
in this wavelength region, an n ! π* transition at around 222 nm,
and π ! π* transitions (both parallel and perpendicular orientations) at $208 and 190 nm. The peptide backbone forms
Fig. 3 Sedimentation coefficient distribution of MAST2. Two species can be
noticed with sedimentation compatible with a main peak of monomer and some
dimer formation in the second peak
PDZ Sample Quality Assessment
97
algorithms [25, 27] using the most adapted model such the continuous size distribution c(S) model presented in the figure for
MAST2-PDZ (Fig. 3).
1.4 Conformational
Stability/Folding State
To verify that the same folding signature can be seen for different
batches of PDZ, one of the classical technique is circular
dichroism (CD).
1.4.1 Circular
Dichroism (CD)
Circular dichroism (CD) relies on the ability of a sample having a
chiral chromophore or placed in an asymmetric environment, to
absorb differently circularly polarized right light and circularly
polarized left light. The spectrum of circular dichroism corresponds
to the difference of absorbance between these two polarizations of
light, for each of the wavelengths. Studying macromolecules by CD
allows to obtain information about their folding. For proteins, far
UV (180–260 nm) and near UV (250–330 nm) circular dichroism
measurements give insight respectively into their secondary structure content and their tertiary organization, respectively. The
far-UV CD spectroscopy of proteins and peptides is predominantly
based on the excitation of electronic transitions in amide groups.
Two types of electron transitions are responsible for the CD signals
in this wavelength region, an n ! π* transition at around 222 nm,
and π ! π* transitions (both parallel and perpendicular orientations) at $208 and 190 nm. The peptide backbone forms
Fig. 3 Sedimentation coefficient distribution of MAST2. Two species can be
noticed with sedimentation compatible with a main peak of monomer and some
dimer formation in the second peak
PDZ Sample Quality Assessment
97