

“Gaussian Blur” (Sigma (radius) ¼ 25) and “Image calculator.” If other stationary fluorescent artefacts are observed, e.g.,
due to drying, crop the affected area in order to ensure correct
colocalization analysis.
19. For colocalization analysis, different software and approaches
are available. For example, the proprietary Imaris software suite
provides common readouts, such as Mander’s coefficients [27]
and good handling of time series. Free features and plug-ins for
ImageJ are also adequate options, such as “Coloc 2” or
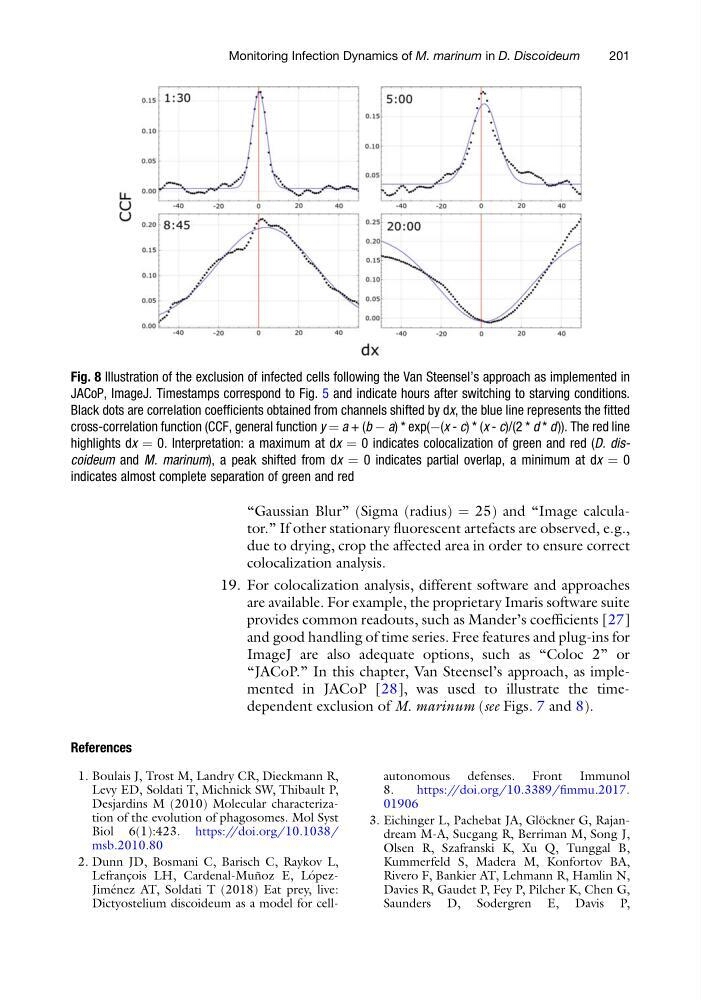
“JACoP.” In this chapter, Van Steensel’s approach, as implemented in JACoP [28], was used to illustrate the timedependent exclusion of M. marinum (see Figs. 7 and 8).
References
1. Boulais J, Trost M, Landry CR, Dieckmann R,
Levy ED, Soldati T, Michnick SW, Thibault P,
Desjardins M (2010) Molecular characterization of the evolution of phagosomes. Mol Syst
Biol 6(1):423. https://doi.org/10.1038/
msb.2010.80
2. Dunn JD, Bosmani C, Barisch C, Raykov L,
Lefranc ¸ois LH, Cardenal-Mun ˜oz E, Lo ´pezJime ´nez AT, Soldati T (2018) Eat prey, live:
Dictyostelium discoideum as a model for cellautonomous defenses. Front Immunol
8.
https://doi.org/10.3389/fimmu.2017.
01906
3. Eichinger L, Pachebat JA, Glo ¨ckner G, Rajandream M-A, Sucgang R, Berriman M, Song J,
Olsen R, Szafranski K, Xu Q, Tunggal B,
Kummerfeld S, Madera M, Konfortov BA,
Rivero F, Bankier AT, Lehmann R, Hamlin N,
Davies R, Gaudet P, Fey P, Pilcher K, Chen G,
Saunders D, Sodergren E, Davis P,
Fig. 8 Illustration of the exclusion of infected cells following the Van Steensel’s approach as implemented in
JACoP, ImageJ. Timestamps correspond to Fig. 5 and indicate hours after switching to starving conditions.
Black dots are correlation coefficients obtained from channels shifted by dx, the blue line represents the fitted
cross-correlation function (CCF, general function y ¼ a + (b À a) * exp(À(x - c) * (x - c)/(2 * d * d)). The red line
highlights dx ¼ 0. Interpretation: a maximum at dx ¼ 0 indicates colocalization of green and red (D. discoideum and M. marinum), a peak shifted from dx ¼ 0 indicates partial overlap, a minimum at dx ¼ 0
indicates almost complete separation of green and red
Monitoring Infection Dynamics of M. marinum in D. Discoideum
201
due to drying, crop the affected area in order to ensure correct
colocalization analysis.
19. For colocalization analysis, different software and approaches
are available. For example, the proprietary Imaris software suite
provides common readouts, such as Mander’s coefficients [27]
and good handling of time series. Free features and plug-ins for
ImageJ are also adequate options, such as “Coloc 2” or
“JACoP.” In this chapter, Van Steensel’s approach, as implemented in JACoP [28], was used to illustrate the timedependent exclusion of M. marinum (see Figs. 7 and 8).
References
1. Boulais J, Trost M, Landry CR, Dieckmann R,
Levy ED, Soldati T, Michnick SW, Thibault P,
Desjardins M (2010) Molecular characterization of the evolution of phagosomes. Mol Syst
Biol 6(1):423. https://doi.org/10.1038/
msb.2010.80
2. Dunn JD, Bosmani C, Barisch C, Raykov L,
Lefranc ¸ois LH, Cardenal-Mun ˜oz E, Lo ´pezJime ´nez AT, Soldati T (2018) Eat prey, live:
Dictyostelium discoideum as a model for cellautonomous defenses. Front Immunol
8.
https://doi.org/10.3389/fimmu.2017.
01906
3. Eichinger L, Pachebat JA, Glo ¨ckner G, Rajandream M-A, Sucgang R, Berriman M, Song J,
Olsen R, Szafranski K, Xu Q, Tunggal B,
Kummerfeld S, Madera M, Konfortov BA,
Rivero F, Bankier AT, Lehmann R, Hamlin N,
Davies R, Gaudet P, Fey P, Pilcher K, Chen G,
Saunders D, Sodergren E, Davis P,
Fig. 8 Illustration of the exclusion of infected cells following the Van Steensel’s approach as implemented in
JACoP, ImageJ. Timestamps correspond to Fig. 5 and indicate hours after switching to starving conditions.
Black dots are correlation coefficients obtained from channels shifted by dx, the blue line represents the fitted
cross-correlation function (CCF, general function y ¼ a + (b À a) * exp(À(x - c) * (x - c)/(2 * d * d)). The red line
highlights dx ¼ 0. Interpretation: a maximum at dx ¼ 0 indicates colocalization of green and red (D. discoideum and M. marinum), a peak shifted from dx ¼ 0 indicates partial overlap, a minimum at dx ¼ 0
indicates almost complete separation of green and red
Monitoring Infection Dynamics of M. marinum in D. Discoideum
201