

Processes 2019, 7,97
solution consistent with obtaining a mature biofilm. A particular cross-feeding relationship was
deemed significant if at least one uptake or secretion flux exceeded 1 mmol/gDW·h.
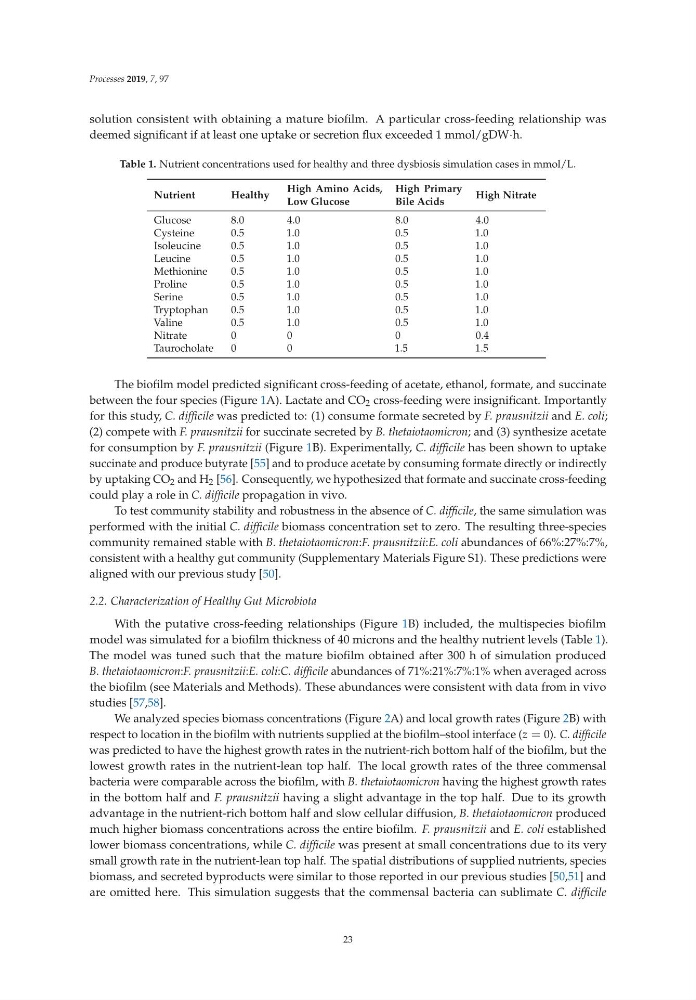
Table 1. Nutrient concentrations used for healthy and three dysbiosis simulation cases in mmol/L.
Nutrient
Healthy
High Amino Acids,
Low Glucose
High Primary
Bile Acids
High Nitrate
Glucose
8.0
4.0
8.0
4.0
Cysteine
0.5
1.0
0.5
1.0
Isoleucine
0.5
1.0
0.5
1.0
Leucine
0.5
1.0
0.5
1.0
Methionine
0.5
1.0
0.5
1.0
Proline
0.5
1.0
0.5
1.0
Serine
0.5
1.0
0.5
1.0
Tryptophan
0.5
1.0
0.5
1.0
Valine
0.5
1.0
0.5
1.0
Nitrate
0
0
0
0.4
Taurocholate
0
0
1.5
1.5
The biofilm model predicted significant cross-feeding of acetate, ethanol, formate, and succinate
between the four species (Figure 1A). Lactate and CO 2 cross-feeding were insignificant. Importantly
for this study, C. difficile was predicted to: (1) consume formate secreted by F. prausnitzii and E. coli;
(2) compete with F. prausnitzii for succinate secreted by B. thetaiotaomicron; and (3) synthesize acetate
for consumption by F. prausnitzii (Figure 1B). Experimentally, C. difficile has been shown to uptake
succinate and produce butyrate [55] and to produce acetate by consuming formate directly or indirectly
by uptaking CO 2 and H 2 [56]. Consequently, we hypothesized that formate and succinate cross-feeding
could play a role in C. difficile propagation in vivo.
To test community stability and robustness in the absence of C. difficile, the same simulation was
performed with the initial C. difficile biomass concentration set to zero. The resulting three-species
community remained stable with B. thetaiotaomicron:F. prausnitzii:E. coli abundances of 66%:27%:7%,
consistent with a healthy gut community (Supplementary Materials Figure S1). These predictions were
aligned with our previous study [50].
2.2. Characterization of Healthy Gut Microbiota
With the putative cross-feeding relationships (Figure 1B) included, the multispecies biofilm
model was simulated for a biofilm thickness of 40 microns and the healthy nutrient levels (Table 1).
The model was tuned such that the mature biofilm obtained after 300 h of simulation produced
B. thetaiotaomicron:F. prausnitzii:E. coli:C. difficile abundances of 71%:21%:7%:1% when averaged across
the biofilm (see Materials and Methods). These abundances were consistent with data from in vivo
studies [57,58].
We analyzed species biomass concentrations (Figure 2A) and local growth rates (Figure 2B) with
respect to location in the biofilm with nutrients supplied at the biofilm–stool interface (z = 0). C. difficile
was predicted to have the highest growth rates in the nutrient-rich bottom half of the biofilm, but the
lowest growth rates in the nutrient-lean top half. The local growth rates of the three commensal
bacteria were comparable across the biofilm, with B. thetaiotaomicron having the highest growth rates
in the bottom half and F. prausnitzii having a slight advantage in the top half. Due to its growth
advantage in the nutrient-rich bottom half and slow cellular diffusion, B. thetaiotaomicron produced
much higher biomass concentrations across the entire biofilm. F. prausnitzii and E. coli established
lower biomass concentrations, while C. difficile was present at small concentrations due to its very
small growth rate in the nutrient-lean top half. The spatial distributions of supplied nutrients, species
biomass, and secreted byproducts were similar to those reported in our previous studies [50,51] and
are omitted here. This simulation suggests that the commensal bacteria can sublimate C. difficile
23
solution consistent with obtaining a mature biofilm. A particular cross-feeding relationship was
deemed significant if at least one uptake or secretion flux exceeded 1 mmol/gDW·h.
Table 1. Nutrient concentrations used for healthy and three dysbiosis simulation cases in mmol/L.
Nutrient
Healthy
High Amino Acids,
Low Glucose
High Primary
Bile Acids
High Nitrate
Glucose
8.0
4.0
8.0
4.0
Cysteine
0.5
1.0
0.5
1.0
Isoleucine
0.5
1.0
0.5
1.0
Leucine
0.5
1.0
0.5
1.0
Methionine
0.5
1.0
0.5
1.0
Proline
0.5
1.0
0.5
1.0
Serine
0.5
1.0
0.5
1.0
Tryptophan
0.5
1.0
0.5
1.0
Valine
0.5
1.0
0.5
1.0
Nitrate
0
0
0
0.4
Taurocholate
0
0
1.5
1.5
The biofilm model predicted significant cross-feeding of acetate, ethanol, formate, and succinate
between the four species (Figure 1A). Lactate and CO 2 cross-feeding were insignificant. Importantly
for this study, C. difficile was predicted to: (1) consume formate secreted by F. prausnitzii and E. coli;
(2) compete with F. prausnitzii for succinate secreted by B. thetaiotaomicron; and (3) synthesize acetate
for consumption by F. prausnitzii (Figure 1B). Experimentally, C. difficile has been shown to uptake
succinate and produce butyrate [55] and to produce acetate by consuming formate directly or indirectly
by uptaking CO 2 and H 2 [56]. Consequently, we hypothesized that formate and succinate cross-feeding
could play a role in C. difficile propagation in vivo.
To test community stability and robustness in the absence of C. difficile, the same simulation was
performed with the initial C. difficile biomass concentration set to zero. The resulting three-species
community remained stable with B. thetaiotaomicron:F. prausnitzii:E. coli abundances of 66%:27%:7%,
consistent with a healthy gut community (Supplementary Materials Figure S1). These predictions were
aligned with our previous study [50].
2.2. Characterization of Healthy Gut Microbiota
With the putative cross-feeding relationships (Figure 1B) included, the multispecies biofilm
model was simulated for a biofilm thickness of 40 microns and the healthy nutrient levels (Table 1).
The model was tuned such that the mature biofilm obtained after 300 h of simulation produced
B. thetaiotaomicron:F. prausnitzii:E. coli:C. difficile abundances of 71%:21%:7%:1% when averaged across
the biofilm (see Materials and Methods). These abundances were consistent with data from in vivo
studies [57,58].
We analyzed species biomass concentrations (Figure 2A) and local growth rates (Figure 2B) with
respect to location in the biofilm with nutrients supplied at the biofilm–stool interface (z = 0). C. difficile
was predicted to have the highest growth rates in the nutrient-rich bottom half of the biofilm, but the
lowest growth rates in the nutrient-lean top half. The local growth rates of the three commensal
bacteria were comparable across the biofilm, with B. thetaiotaomicron having the highest growth rates
in the bottom half and F. prausnitzii having a slight advantage in the top half. Due to its growth
advantage in the nutrient-rich bottom half and slow cellular diffusion, B. thetaiotaomicron produced
much higher biomass concentrations across the entire biofilm. F. prausnitzii and E. coli established
lower biomass concentrations, while C. difficile was present at small concentrations due to its very
small growth rate in the nutrient-lean top half. The spatial distributions of supplied nutrients, species
biomass, and secreted byproducts were similar to those reported in our previous studies [50,51] and
are omitted here. This simulation suggests that the commensal bacteria can sublimate C. difficile
23