

Processes 2019, 7, 163
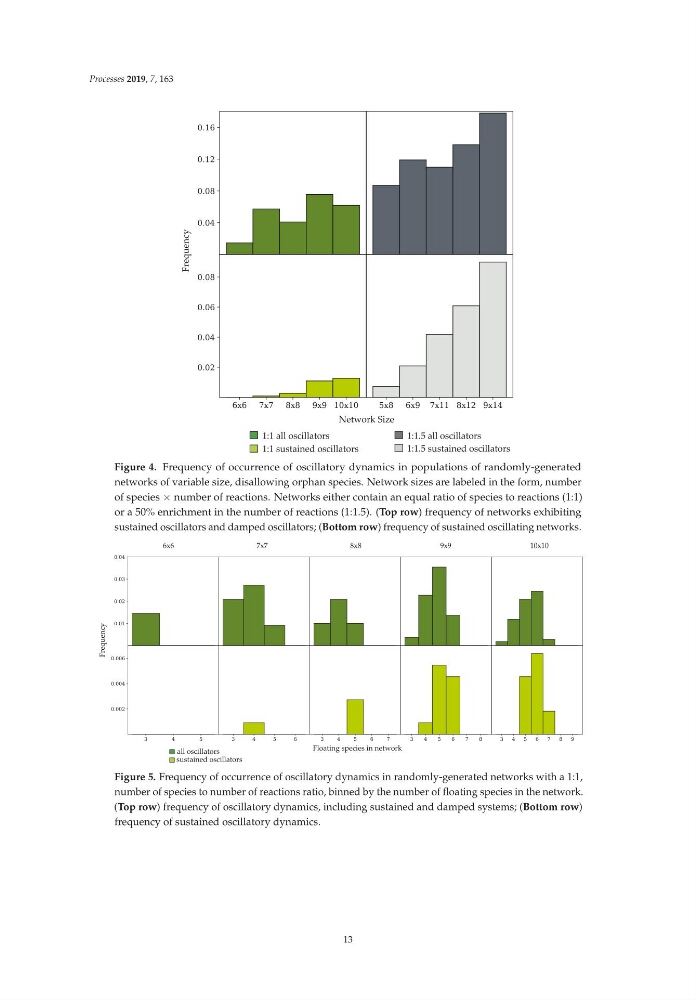
Figure 4. Frequency of occurrence of oscillatory dynamics in populations of randomly-generated
networks of variable size, disallowing orphan species. Network sizes are labeled in the form, number
of species × number of reactions. Networks either contain an equal ratio of species to reactions (1:1)
or a 50% enrichment in the number of reactions (1:1.5). (Top row) frequency of networks exhibiting
sustained oscillators and damped oscillators; (Bottom row) frequency of sustained oscillating networks.
Figure 5. Frequency of occurrence of oscillatory dynamics in randomly-generated networks with a 1:1,
number of species to number of reactions ratio, binned by the number of floating species in the network.
(Top row) frequency of oscillatory dynamics, including sustained and damped systems; (Bottom row)
frequency of sustained oscillatory dynamics.
13
Figure 4. Frequency of occurrence of oscillatory dynamics in populations of randomly-generated
networks of variable size, disallowing orphan species. Network sizes are labeled in the form, number
of species × number of reactions. Networks either contain an equal ratio of species to reactions (1:1)
or a 50% enrichment in the number of reactions (1:1.5). (Top row) frequency of networks exhibiting
sustained oscillators and damped oscillators; (Bottom row) frequency of sustained oscillating networks.
Figure 5. Frequency of occurrence of oscillatory dynamics in randomly-generated networks with a 1:1,
number of species to number of reactions ratio, binned by the number of floating species in the network.
(Top row) frequency of oscillatory dynamics, including sustained and damped systems; (Bottom row)
frequency of sustained oscillatory dynamics.
13