

Processes 2019, 7, 163
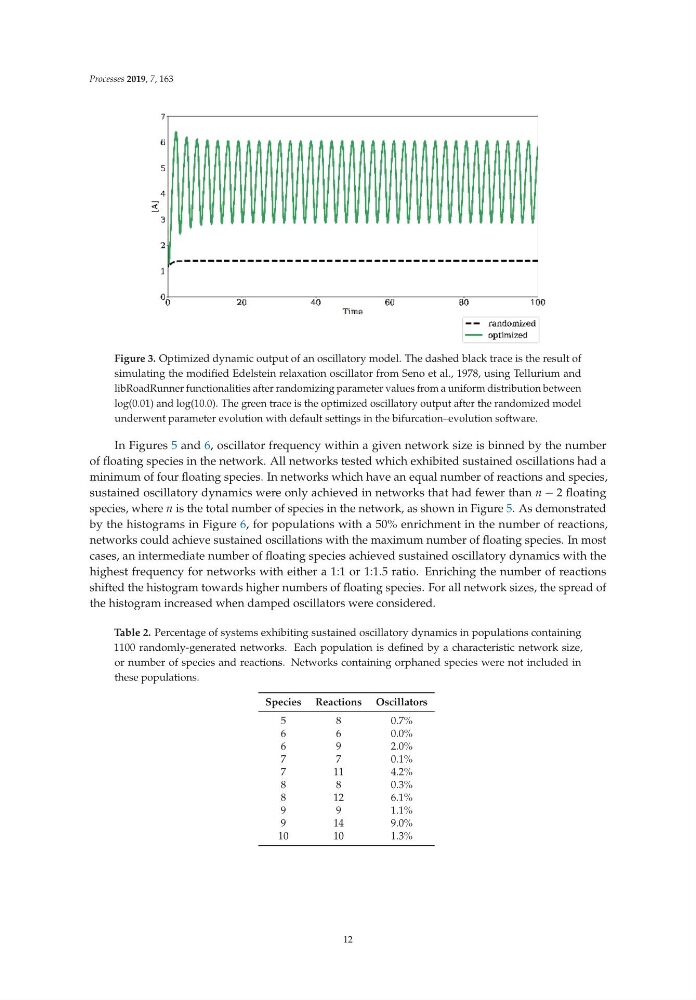
Figure 3. Optimized dynamic output of an oscillatory model. The dashed black trace is the result of
simulating the modified Edelstein relaxation oscillator from Seno et al., 1978, using Tellurium and
libRoadRunner functionalities after randomizing parameter values from a uniform distribution between
log(0.01) and log(10.0). The green trace is the optimized oscillatory output after the randomized model
underwent parameter evolution with default settings in the bifurcation–evolution software.
In Figures 5 and 6, oscillator frequency within a given network size is binned by the number
of floating species in the network. All networks tested which exhibited sustained oscillations had a
minimum of four floating species. In networks which have an equal number of reactions and species,
sustained oscillatory dynamics were only achieved in networks that had fewer than n − 2 floating
species, where n is the total number of species in the network, as shown in Figure 5. As demonstrated
by the histograms in Figure 6, for populations with a 50% enrichment in the number of reactions,
networks could achieve sustained oscillations with the maximum number of floating species. In most
cases, an intermediate number of floating species achieved sustained oscillatory dynamics with the
highest frequency for networks with either a 1:1 or 1:1.5 ratio. Enriching the number of reactions
shifted the histogram towards higher numbers of floating species. For all network sizes, the spread of
the histogram increased when damped oscillators were considered.
Table 2. Percentage of systems exhibiting sustained oscillatory dynamics in populations containing
1100 randomly-generated networks. Each population is defined by a characteristic network size,
or number of species and reactions. Networks containing orphaned species were not included in
these populations.
Species Reactions Oscillators
5
8
0.7%
6
6
0.0%
6
9
2.0%
7
7
0.1%
7
11
4.2%
8
8
0.3%
8
12
6.1%
9
9
1.1%
9
14
9.0%
10
10
1.3%
12
Figure 3. Optimized dynamic output of an oscillatory model. The dashed black trace is the result of
simulating the modified Edelstein relaxation oscillator from Seno et al., 1978, using Tellurium and
libRoadRunner functionalities after randomizing parameter values from a uniform distribution between
log(0.01) and log(10.0). The green trace is the optimized oscillatory output after the randomized model
underwent parameter evolution with default settings in the bifurcation–evolution software.
In Figures 5 and 6, oscillator frequency within a given network size is binned by the number
of floating species in the network. All networks tested which exhibited sustained oscillations had a
minimum of four floating species. In networks which have an equal number of reactions and species,
sustained oscillatory dynamics were only achieved in networks that had fewer than n − 2 floating
species, where n is the total number of species in the network, as shown in Figure 5. As demonstrated
by the histograms in Figure 6, for populations with a 50% enrichment in the number of reactions,
networks could achieve sustained oscillations with the maximum number of floating species. In most
cases, an intermediate number of floating species achieved sustained oscillatory dynamics with the
highest frequency for networks with either a 1:1 or 1:1.5 ratio. Enriching the number of reactions
shifted the histogram towards higher numbers of floating species. For all network sizes, the spread of
the histogram increased when damped oscillators were considered.
Table 2. Percentage of systems exhibiting sustained oscillatory dynamics in populations containing
1100 randomly-generated networks. Each population is defined by a characteristic network size,
or number of species and reactions. Networks containing orphaned species were not included in
these populations.
Species Reactions Oscillators
5
8
0.7%
6
6
0.0%
6
9
2.0%
7
7
0.1%
7
11
4.2%
8
8
0.3%
8
12
6.1%
9
9
1.1%
9
14
9.0%
10
10
1.3%
12