

Processes 2018, 6,38
genome and under-measured in the laboratory among the three species tested, although no explanation
has been linked to this observation in the literature.
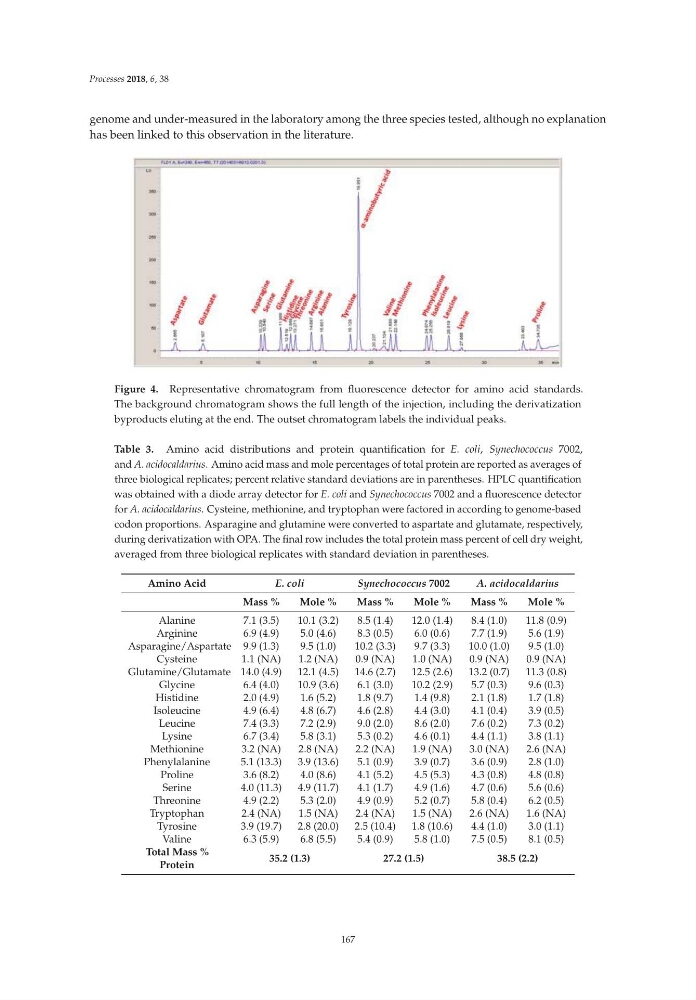
Figure 4. Representative chromatogram from fluorescence detector for amino acid standards.
The background chromatogram shows the full length of the injection, including the derivatization
byproducts eluting at the end. The outset chromatogram labels the individual peaks.
Table 3. Amino acid distributions and protein quantification for E. coli, Synechococcus 7002,
and A. acidocaldarius. Amino acid mass and mole percentages of total protein are reported as averages of
three biological replicates; percent relative standard deviations are in parentheses. HPLC quantification
was obtained with a diode array detector for E. coli and Synechococcus 7002 and a fluorescence detector
for A. acidocaldarius. Cysteine, methionine, and tryptophan were factored in according to genome-based
codon proportions. Asparagine and glutamine were converted to aspartate and glutamate, respectively,
during derivatization with OPA. The final row includes the total protein mass percent of cell dry weight,
averaged from three biological replicates with standard deviation in parentheses.
Amino Acid
E. coli
Synechococcus 7002
A. acidocaldarius
Mass %
Mole %
Mass %
Mole %
Mass %
Mole %
Alanine
7.1 (3.5)
10.1 (3.2)
8.5 (1.4)
12.0 (1.4)
8.4 (1.0)
11.8 (0.9)
Arginine
6.9 (4.9)
5.0 (4.6)
8.3 (0.5)
6.0 (0.6)
7.7 (1.9)
5.6 (1.9)
Asparagine/Aspartate 9.9 (1.3)
9.5 (1.0)
10.2 (3.3)
9.7 (3.3)
10.0 (1.0)
9.5 (1.0)
Cysteine
1.1 (NA)
1.2 (NA)
0.9 (NA)
1.0 (NA)
0.9 (NA)
0.9 (NA)
Glutamine/Glutamate 14.0 (4.9)
12.1 (4.5)
14.6 (2.7)
12.5 (2.6)
13.2 (0.7)
11.3 (0.8)
Glycine
6.4 (4.0)
10.9 (3.6)
6.1 (3.0)
10.2 (2.9)
5.7 (0.3)
9.6 (0.3)
Histidine
2.0 (4.9)
1.6 (5.2)
1.8 (9.7)
1.4 (9.8)
2.1 (1.8)
1.7 (1.8)
Isoleucine
4.9 (6.4)
4.8 (6.7)
4.6 (2.8)
4.4 (3.0)
4.1 (0.4)
3.9 (0.5)
Leucine
7.4 (3.3)
7.2 (2.9)
9.0 (2.0)
8.6 (2.0)
7.6 (0.2)
7.3 (0.2)
Lysine
6.7 (3.4)
5.8 (3.1)
5.3 (0.2)
4.6 (0.1)
4.4 (1.1)
3.8 (1.1)
Methionine
3.2 (NA)
2.8 (NA)
2.2 (NA)
1.9 (NA)
3.0 (NA)
2.6 (NA)
Phenylalanine
5.1 (13.3)
3.9 (13.6)
5.1 (0.9)
3.9 (0.7)
3.6 (0.9)
2.8 (1.0)
Proline
3.6 (8.2)
4.0 (8.6)
4.1 (5.2)
4.5 (5.3)
4.3 (0.8)
4.8 (0.8)
Serine
4.0 (11.3)
4.9 (11.7)
4.1 (1.7)
4.9 (1.6)
4.7 (0.6)
5.6 (0.6)
Threonine
4.9 (2.2)
5.3 (2.0)
4.9 (0.9)
5.2 (0.7)
5.8 (0.4)
6.2 (0.5)
Tryptophan
2.4 (NA)
1.5 (NA)
2.4 (NA)
1.5 (NA)
2.6 (NA)
1.6 (NA)
Tyrosine
3.9 (19.7)
2.8 (20.0)
2.5 (10.4)
1.8 (10.6)
4.4 (1.0)
3.0 (1.1)
Valine
6.3 (5.9)
6.8 (5.5)
5.4 (0.9)
5.8 (1.0)
7.5 (0.5)
8.1 (0.5)
Total Mass %
Protein
35.2 (1.3)
27.2 (1.5)
38.5 (2.2)
167
genome and under-measured in the laboratory among the three species tested, although no explanation
has been linked to this observation in the literature.
Figure 4. Representative chromatogram from fluorescence detector for amino acid standards.
The background chromatogram shows the full length of the injection, including the derivatization
byproducts eluting at the end. The outset chromatogram labels the individual peaks.
Table 3. Amino acid distributions and protein quantification for E. coli, Synechococcus 7002,
and A. acidocaldarius. Amino acid mass and mole percentages of total protein are reported as averages of
three biological replicates; percent relative standard deviations are in parentheses. HPLC quantification
was obtained with a diode array detector for E. coli and Synechococcus 7002 and a fluorescence detector
for A. acidocaldarius. Cysteine, methionine, and tryptophan were factored in according to genome-based
codon proportions. Asparagine and glutamine were converted to aspartate and glutamate, respectively,
during derivatization with OPA. The final row includes the total protein mass percent of cell dry weight,
averaged from three biological replicates with standard deviation in parentheses.
Amino Acid
E. coli
Synechococcus 7002
A. acidocaldarius
Mass %
Mole %
Mass %
Mole %
Mass %
Mole %
Alanine
7.1 (3.5)
10.1 (3.2)
8.5 (1.4)
12.0 (1.4)
8.4 (1.0)
11.8 (0.9)
Arginine
6.9 (4.9)
5.0 (4.6)
8.3 (0.5)
6.0 (0.6)
7.7 (1.9)
5.6 (1.9)
Asparagine/Aspartate 9.9 (1.3)
9.5 (1.0)
10.2 (3.3)
9.7 (3.3)
10.0 (1.0)
9.5 (1.0)
Cysteine
1.1 (NA)
1.2 (NA)
0.9 (NA)
1.0 (NA)
0.9 (NA)
0.9 (NA)
Glutamine/Glutamate 14.0 (4.9)
12.1 (4.5)
14.6 (2.7)
12.5 (2.6)
13.2 (0.7)
11.3 (0.8)
Glycine
6.4 (4.0)
10.9 (3.6)
6.1 (3.0)
10.2 (2.9)
5.7 (0.3)
9.6 (0.3)
Histidine
2.0 (4.9)
1.6 (5.2)
1.8 (9.7)
1.4 (9.8)
2.1 (1.8)
1.7 (1.8)
Isoleucine
4.9 (6.4)
4.8 (6.7)
4.6 (2.8)
4.4 (3.0)
4.1 (0.4)
3.9 (0.5)
Leucine
7.4 (3.3)
7.2 (2.9)
9.0 (2.0)
8.6 (2.0)
7.6 (0.2)
7.3 (0.2)
Lysine
6.7 (3.4)
5.8 (3.1)
5.3 (0.2)
4.6 (0.1)
4.4 (1.1)
3.8 (1.1)
Methionine
3.2 (NA)
2.8 (NA)
2.2 (NA)
1.9 (NA)
3.0 (NA)
2.6 (NA)
Phenylalanine
5.1 (13.3)
3.9 (13.6)
5.1 (0.9)
3.9 (0.7)
3.6 (0.9)
2.8 (1.0)
Proline
3.6 (8.2)
4.0 (8.6)
4.1 (5.2)
4.5 (5.3)
4.3 (0.8)
4.8 (0.8)
Serine
4.0 (11.3)
4.9 (11.7)
4.1 (1.7)
4.9 (1.6)
4.7 (0.6)
5.6 (0.6)
Threonine
4.9 (2.2)
5.3 (2.0)
4.9 (0.9)
5.2 (0.7)
5.8 (0.4)
6.2 (0.5)
Tryptophan
2.4 (NA)
1.5 (NA)
2.4 (NA)
1.5 (NA)
2.6 (NA)
1.6 (NA)
Tyrosine
3.9 (19.7)
2.8 (20.0)
2.5 (10.4)
1.8 (10.6)
4.4 (1.0)
3.0 (1.1)
Valine
6.3 (5.9)
6.8 (5.5)
5.4 (0.9)
5.8 (1.0)
7.5 (0.5)
8.1 (0.5)
Total Mass %
Protein
35.2 (1.3)
27.2 (1.5)
38.5 (2.2)
167