

Processes 2018, 6,38
(4) Neutralize to pH 7.0 with 6 M NaOH.
(5) Filter with 0.22 µm PVDF centrifugal filters (Millipore UFC30GV00, Burlington, MA, USA);
centrifuge for 5 min at 10,000 rpm.
(6) Transfer filtrate to clean borosilicate HPLC vial, seal with parafilm, and poke a hole in the top
(e.g., with a small pipette tip). Place at −80 ◦ C to freeze before lyophilizing.
(7) Lyophilize for 24 h (VirTis benchtop lyophilizer).
(8) Store at −80 ◦ C until HPLC analysis.
(9) Re-suspend lyophilized material in 0.1 M HCl, and perform HPLC analysis according to the
protocol validated by Agilent Technologies [66].
Notes: PVDF was selected as the filter membrane material due to its low protein binding capacity;
materials with high protein binding such as nylon may affect amino acids. A fluorescence detector or
diode array detector can be used for detection. The current work employed an Agilent 1100 HPLC
system equipped with autosampler and fluorescence detector (for A. acidocaldarius samples) or diode
array detector (for E. coli and Synechococcus 7002 samples). A diode array detector was less sensitive
than a fluorescence detector (limit of detection ~100 µM vs. ~2 µM). o-phthalaldehyde (OPA) reagent
with 3-mercaptopropionic acid as a stabilizing agent was used for detection of primary amino acids,
and 9-fluorenylmethyl chloroformate (FMOC) reagent was used for secondary amino acids. OPA and
FMOC reagents were replaced daily in amber vials and were used within 10 days upon opening an
ampule. The flow rate was modified from 2 mL/min [66] to 1 mL/min to permit increased resolution
of peaks (see gradient settings in Table 2). The injector program followed the steps described in
Henderson et al. [66] but did not make use of the optional acetonitrile needle rinse. The integration
parameters for collecting the data were set to a slope sensitivity of 1, peak width of 0.04, area reject of
1, and height reject of 0.4, with shoulders off. Amino acids were identified manually in the calibration
table, and undesired peaks were discarded (derivatization byproduct peaks at the end of an injection).
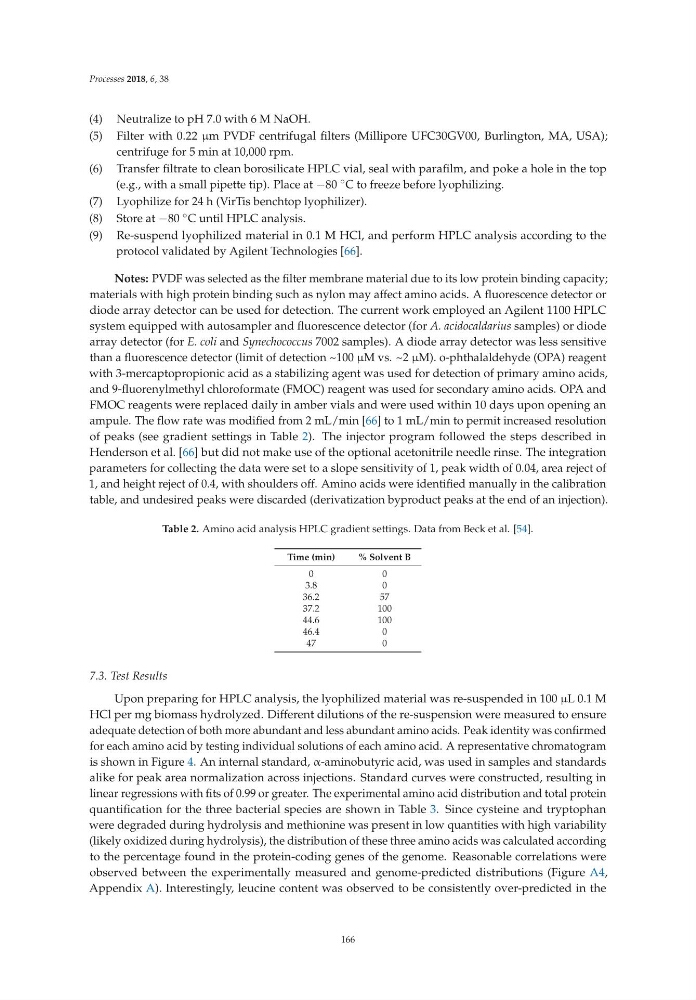
Table 2. Amino acid analysis HPLC gradient settings. Data from Beck et al. [54].
Time (min)
% Solvent B
00
3.8
0
36.2
57
37.2
100
44.6
100
46.4
0
47
0
7.3. Test Results
Upon preparing for HPLC analysis, the lyophilized material was re-suspended in 100 µL 0.1 M
HCl per mg biomass hydrolyzed. Different dilutions of the re-suspension were measured to ensure
adequate detection of both more abundant and less abundant amino acids. Peak identity was confirmed
for each amino acid by testing individual solutions of each amino acid. A representative chromatogram
is shown in Figure 4. An internal standard, α-aminobutyric acid, was used in samples and standards
alike for peak area normalization across injections. Standard curves were constructed, resulting in
linear regressions with fits of 0.99 or greater. The experimental amino acid distribution and total protein
quantification for the three bacterial species are shown in Table 3. Since cysteine and tryptophan
were degraded during hydrolysis and methionine was present in low quantities with high variability
(likely oxidized during hydrolysis), the distribution of these three amino acids was calculated according
to the percentage found in the protein-coding genes of the genome. Reasonable correlations were
observed between the experimentally measured and genome-predicted distributions (Figure A4,
Appendix A). Interestingly, leucine content was observed to be consistently over-predicted in the
166
(4) Neutralize to pH 7.0 with 6 M NaOH.
(5) Filter with 0.22 µm PVDF centrifugal filters (Millipore UFC30GV00, Burlington, MA, USA);
centrifuge for 5 min at 10,000 rpm.
(6) Transfer filtrate to clean borosilicate HPLC vial, seal with parafilm, and poke a hole in the top
(e.g., with a small pipette tip). Place at −80 ◦ C to freeze before lyophilizing.
(7) Lyophilize for 24 h (VirTis benchtop lyophilizer).
(8) Store at −80 ◦ C until HPLC analysis.
(9) Re-suspend lyophilized material in 0.1 M HCl, and perform HPLC analysis according to the
protocol validated by Agilent Technologies [66].
Notes: PVDF was selected as the filter membrane material due to its low protein binding capacity;
materials with high protein binding such as nylon may affect amino acids. A fluorescence detector or
diode array detector can be used for detection. The current work employed an Agilent 1100 HPLC
system equipped with autosampler and fluorescence detector (for A. acidocaldarius samples) or diode
array detector (for E. coli and Synechococcus 7002 samples). A diode array detector was less sensitive
than a fluorescence detector (limit of detection ~100 µM vs. ~2 µM). o-phthalaldehyde (OPA) reagent
with 3-mercaptopropionic acid as a stabilizing agent was used for detection of primary amino acids,
and 9-fluorenylmethyl chloroformate (FMOC) reagent was used for secondary amino acids. OPA and
FMOC reagents were replaced daily in amber vials and were used within 10 days upon opening an
ampule. The flow rate was modified from 2 mL/min [66] to 1 mL/min to permit increased resolution
of peaks (see gradient settings in Table 2). The injector program followed the steps described in
Henderson et al. [66] but did not make use of the optional acetonitrile needle rinse. The integration
parameters for collecting the data were set to a slope sensitivity of 1, peak width of 0.04, area reject of
1, and height reject of 0.4, with shoulders off. Amino acids were identified manually in the calibration
table, and undesired peaks were discarded (derivatization byproduct peaks at the end of an injection).
Table 2. Amino acid analysis HPLC gradient settings. Data from Beck et al. [54].
Time (min)
% Solvent B
00
3.8
0
36.2
57
37.2
100
44.6
100
46.4
0
47
0
7.3. Test Results
Upon preparing for HPLC analysis, the lyophilized material was re-suspended in 100 µL 0.1 M
HCl per mg biomass hydrolyzed. Different dilutions of the re-suspension were measured to ensure
adequate detection of both more abundant and less abundant amino acids. Peak identity was confirmed
for each amino acid by testing individual solutions of each amino acid. A representative chromatogram
is shown in Figure 4. An internal standard, α-aminobutyric acid, was used in samples and standards
alike for peak area normalization across injections. Standard curves were constructed, resulting in
linear regressions with fits of 0.99 or greater. The experimental amino acid distribution and total protein
quantification for the three bacterial species are shown in Table 3. Since cysteine and tryptophan
were degraded during hydrolysis and methionine was present in low quantities with high variability
(likely oxidized during hydrolysis), the distribution of these three amino acids was calculated according
to the percentage found in the protein-coding genes of the genome. Reasonable correlations were
observed between the experimentally measured and genome-predicted distributions (Figure A4,
Appendix A). Interestingly, leucine content was observed to be consistently over-predicted in the
166