

Processes 2018, 6,39
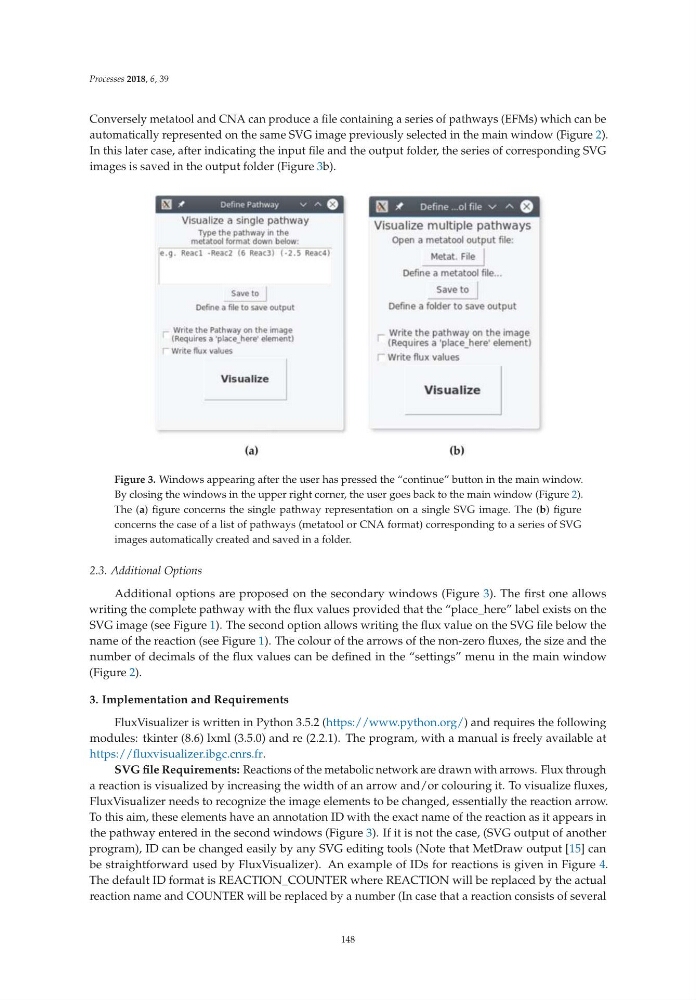
Conversely metatool and CNA can produce a file containing a series of pathways (EFMs) which can be
automatically represented on the same SVG image previously selected in the main window (Figure 2).
In this later case, after indicating the input file and the output folder, the series of corresponding SVG
images is saved in the output folder (Figure 3b).
Figure 3. Windows appearing after the user has pressed the “continue” button in the main window.
By closing the windows in the upper right corner, the user goes back to the main window (Figure 2).
The (a) figure concerns the single pathway representation on a single SVG image. The (b) figure
concerns the case of a list of pathways (metatool or CNA format) corresponding to a series of SVG
images automatically created and saved in a folder.
2.3. Additional Options
Additional options are proposed on the secondary windows (Figure 3). The first one allows
writing the complete pathway with the flux values provided that the “place_here” label exists on the
SVG image (see Figure 1). The second option allows writing the flux value on the SVG file below the
name of the reaction (see Figure 1). The colour of the arrows of the non-zero fluxes, the size and the
number of decimals of the flux values can be defined in the “settings” menu in the main window
(Figure 2).
3. Implementation and Requirements
FluxVisualizer is written in Python 3.5.2 (https://www.python.org/) and requires the following
modules: tkinter (8.6) lxml (3.5.0) and re (2.2.1). The program, with a manual is freely available at
https://fluxvisualizer.ibgc.cnrs.fr.
SVG file Requirements: Reactions of the metabolic network are drawn with arrows. Flux through
a reaction is visualized by increasing the width of an arrow and/or colouring it. To visualize fluxes,
FluxVisualizer needs to recognize the image elements to be changed, essentially the reaction arrow.
To this aim, these elements have an annotation ID with the exact name of the reaction as it appears in
the pathway entered in the second windows (Figure 3). If it is not the case, (SVG output of another
program), ID can be changed easily by any SVG editing tools (Note that MetDraw output [15] can
be straightforward used by FluxVisualizer). An example of IDs for reactions is given in Figure 4.
The default ID format is REACTION_COUNTER where REACTION will be replaced by the actual
reaction name and COUNTER will be replaced by a number (In case that a reaction consists of several
148
Conversely metatool and CNA can produce a file containing a series of pathways (EFMs) which can be
automatically represented on the same SVG image previously selected in the main window (Figure 2).
In this later case, after indicating the input file and the output folder, the series of corresponding SVG
images is saved in the output folder (Figure 3b).
Figure 3. Windows appearing after the user has pressed the “continue” button in the main window.
By closing the windows in the upper right corner, the user goes back to the main window (Figure 2).
The (a) figure concerns the single pathway representation on a single SVG image. The (b) figure
concerns the case of a list of pathways (metatool or CNA format) corresponding to a series of SVG
images automatically created and saved in a folder.
2.3. Additional Options
Additional options are proposed on the secondary windows (Figure 3). The first one allows
writing the complete pathway with the flux values provided that the “place_here” label exists on the
SVG image (see Figure 1). The second option allows writing the flux value on the SVG file below the
name of the reaction (see Figure 1). The colour of the arrows of the non-zero fluxes, the size and the
number of decimals of the flux values can be defined in the “settings” menu in the main window
(Figure 2).
3. Implementation and Requirements
FluxVisualizer is written in Python 3.5.2 (https://www.python.org/) and requires the following
modules: tkinter (8.6) lxml (3.5.0) and re (2.2.1). The program, with a manual is freely available at
https://fluxvisualizer.ibgc.cnrs.fr.
SVG file Requirements: Reactions of the metabolic network are drawn with arrows. Flux through
a reaction is visualized by increasing the width of an arrow and/or colouring it. To visualize fluxes,
FluxVisualizer needs to recognize the image elements to be changed, essentially the reaction arrow.
To this aim, these elements have an annotation ID with the exact name of the reaction as it appears in
the pathway entered in the second windows (Figure 3). If it is not the case, (SVG output of another
program), ID can be changed easily by any SVG editing tools (Note that MetDraw output [15] can
be straightforward used by FluxVisualizer). An example of IDs for reactions is given in Figure 4.
The default ID format is REACTION_COUNTER where REACTION will be replaced by the actual
reaction name and COUNTER will be replaced by a number (In case that a reaction consists of several
148