

Processes 2018, 6,39
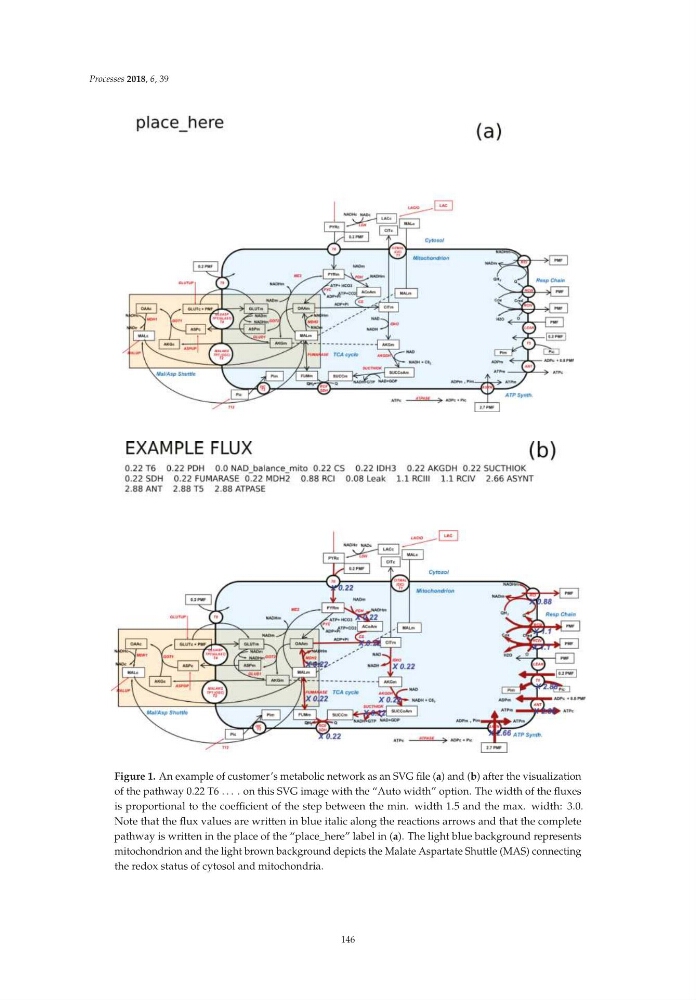
Figure 1. An example of customer’s metabolic network as an SVG file (a) and (b) after the visualization
of the pathway 0.22 T6 ... . on this SVG image with the “Auto width” option. The width of the fluxes
is proportional to the coefficient of the step between the min. width 1.5 and the max. width: 3.0.
Note that the flux values are written in blue italic along the reactions arrows and that the complete
pathway is written in the place of the “place_here” label in (a). The light blue background represents
mitochondrion and the light brown background depicts the Malate Aspartate Shuttle (MAS) connecting
the redox status of cytosol and mitochondria.
146
Figure 1. An example of customer’s metabolic network as an SVG file (a) and (b) after the visualization
of the pathway 0.22 T6 ... . on this SVG image with the “Auto width” option. The width of the fluxes
is proportional to the coefficient of the step between the min. width 1.5 and the max. width: 3.0.
Note that the flux values are written in blue italic along the reactions arrows and that the complete
pathway is written in the place of the “place_here” label in (a). The light blue background represents
mitochondrion and the light brown background depicts the Malate Aspartate Shuttle (MAS) connecting
the redox status of cytosol and mitochondria.
146