

Processes 2018, 6,82
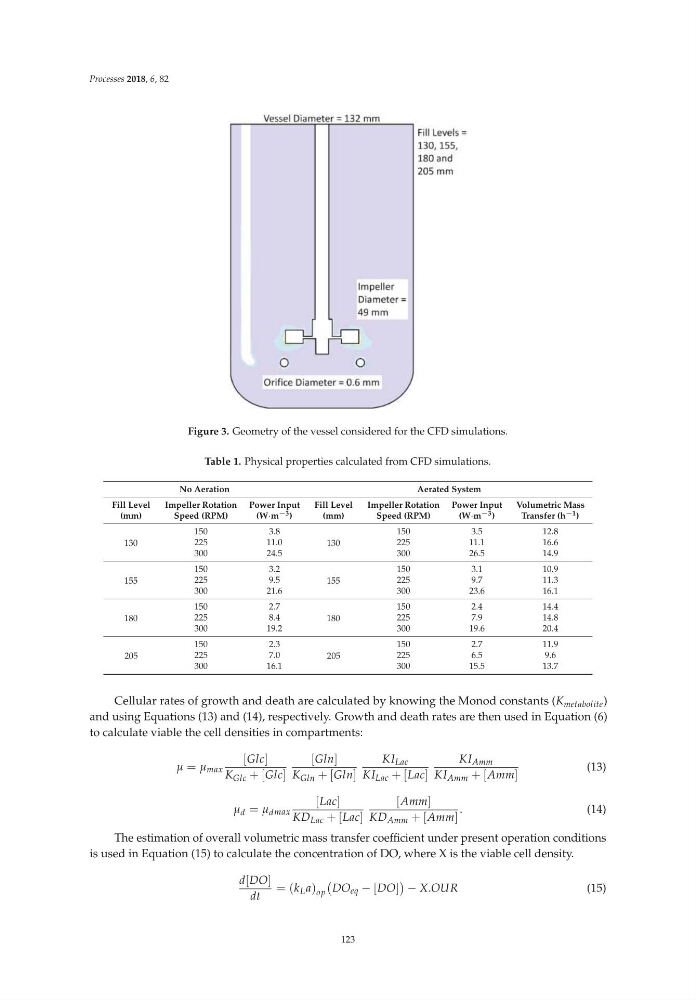
Figure 3. Geometry of the vessel considered for the CFD simulations.
Table 1. Physical properties calculated from CFD simulations.
No Aeration
Aerated System
Fill Level
(mm)
Impeller Rotation
Speed (RPM)
Power Input
(W·m −3 )
Fill Level
(mm)
Impeller Rotation
Speed (RPM)
Power Input
(W·m −3 )
Volumetric Mass
Transfer (h −1 )
130
150
3.8
130
150
3.5
12.8
225
11.0
225
11.1
16.6
300
24.5
300
26.5
14.9
155
150
3.2
155
150
3.1
10.9
225
9.5
225
9.7
11.3
300
21.6
300
23.6
16.1
180
150
2.7
180
150
2.4
14.4
225
8.4
225
7.9
14.8
300
19.2
300
19.6
20.4
205
150
2.3
205
150
2.7
11.9
225
7.0
225
6.5
9.6
300
16.1
300
15.5
13.7
Cellular rates of growth and death are calculated by knowing the Monod constants (K metabolite )
and using Equations (13) and (14), respectively. Growth and death rates are then used in Equation (6)
to calculate viable the cell densities in compartments:
μ = μ max
[Glc]
K Glc + [Glc]
[Gln]
K Gln + [Gln]
KI Lac
KI Lac + [Lac]
KI Amm
KI Amm + [Amm]
(13)
μ d = μ dmax
[Lac]
KD Lac + [Lac]
[Amm]
KD Amm + [Amm]
.
(14)
The estimation of overall volumetric mass transfer coefficient under present operation conditions
is used in Equation (15) to calculate the concentration of DO, where X is the viable cell density.
d[DO]
dt
=(k L a) op
DO eq − [DO]
− X.OUR
(15)
123
Figure 3. Geometry of the vessel considered for the CFD simulations.
Table 1. Physical properties calculated from CFD simulations.
No Aeration
Aerated System
Fill Level
(mm)
Impeller Rotation
Speed (RPM)
Power Input
(W·m −3 )
Fill Level
(mm)
Impeller Rotation
Speed (RPM)
Power Input
(W·m −3 )
Volumetric Mass
Transfer (h −1 )
130
150
3.8
130
150
3.5
12.8
225
11.0
225
11.1
16.6
300
24.5
300
26.5
14.9
155
150
3.2
155
150
3.1
10.9
225
9.5
225
9.7
11.3
300
21.6
300
23.6
16.1
180
150
2.7
180
150
2.4
14.4
225
8.4
225
7.9
14.8
300
19.2
300
19.6
20.4
205
150
2.3
205
150
2.7
11.9
225
7.0
225
6.5
9.6
300
16.1
300
15.5
13.7
Cellular rates of growth and death are calculated by knowing the Monod constants (K metabolite )
and using Equations (13) and (14), respectively. Growth and death rates are then used in Equation (6)
to calculate viable the cell densities in compartments:
μ = μ max
[Glc]
K Glc + [Glc]
[Gln]
K Gln + [Gln]
KI Lac
KI Lac + [Lac]
KI Amm
KI Amm + [Amm]
(13)
μ d = μ dmax
[Lac]
KD Lac + [Lac]
[Amm]
KD Amm + [Amm]
.
(14)
The estimation of overall volumetric mass transfer coefficient under present operation conditions
is used in Equation (15) to calculate the concentration of DO, where X is the viable cell density.
d[DO]
dt
=(k L a) op
DO eq − [DO]
− X.OUR
(15)
123