

Processes 2018, 6,82
of bubble vicinity is calculated using the reported average bubble diameter of 0.00289 m [53] and
assuming a particular value for critical distance from the surface of bubbles. The critical distance is
assumed to be equal to the cell radius. The number of bubbles is calculated using gas holdup in the
compartment obtained from CFD simulations and the reported value for average bubble diameter.
Average bubble lifespan is calculated using the gas holdup and air sparging flowrate. Equation (5)
shows the estimated rate of loss of cells due to interactions with bubbles under operating condition op
and in compartment c:
k d,bubbleop,c =
ln (1 −
volume o f the interaction vicinity×number o f bubblesop,c
volumec
)
bubble li f espan op,c
.
(5)
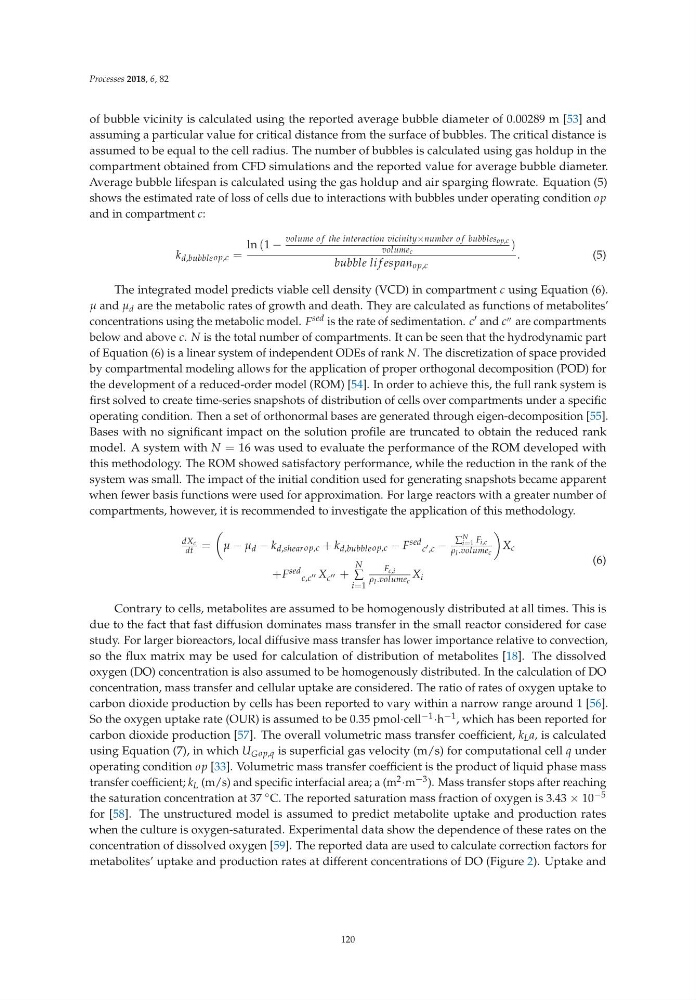
The integrated model predicts viable cell density (VCD) in compartment c using Equation (6).
μ and μ d are the metabolic rates of growth and death. They are calculated as functions of metabolites’
concentrations using the metabolic model. F sed is the rate of sedimentation. c ′ and c ′′ are compartments
below and above c. N is the total number of compartments. It can be seen that the hydrodynamic part
of Equation (6) is a linear system of independent ODEs of rank N. The discretization of space provided
by compartmental modeling allows for the application of proper orthogonal decomposition (POD) for
the development of a reduced-order model (ROM) [54]. In order to achieve this, the full rank system is
first solved to create time-series snapshots of distribution of cells over compartments under a specific
operating condition. Then a set of orthonormal bases are generated through eigen-decomposition [55].
Bases with no significant impact on the solution profile are truncated to obtain the reduced rank
model. A system with N = 16 was used to evaluate the performance of the ROM developed with
this methodology. The ROM showed satisfactory performance, while the reduction in the rank of the
system was small. The impact of the initial condition used for generating snapshots became apparent
when fewer basis functions were used for approximation. For large reactors with a greater number of
compartments, however, it is recommended to investigate the application of this methodology.
dXc
dt =
μ − μ d − k d,shearop,c + k d,bubbleop,c − F sed
c ′ ,c −
∑
N
i=1 F i,c
ρ l .volumec
X c
+F sed
c,c ′′ X c ′′ +
N
∑
i=1
F c,i
ρ l .volumec X i
(6)
Contrary to cells, metabolites are assumed to be homogenously distributed at all times. This is
due to the fact that fast diffusion dominates mass transfer in the small reactor considered for case
study. For larger bioreactors, local diffusive mass transfer has lower importance relative to convection,
so the flux matrix may be used for calculation of distribution of metabolites [18]. The dissolved
oxygen (DO) concentration is also assumed to be homogenously distributed. In the calculation of DO
concentration, mass transfer and cellular uptake are considered. The ratio of rates of oxygen uptake to
carbon dioxide production by cells has been reported to vary within a narrow range around 1 [56].
So the oxygen uptake rate (OUR) is assumed to be 0.35 pmol·cell −1 ·h −1 , which has been reported for
carbon dioxide production [57]. The overall volumetric mass transfer coefficient, k L a, is calculated
using Equation (7), in which U G op,q is superficial gas velocity (m/s) for computational cell q under
operating condition op [33]. Volumetric mass transfer coefficient is the product of liquid phase mass
transfer coefficient; k L (m/s) and specific interfacial area; a (m 2 ·m −3 ). Mass transfer stops after reaching
the saturation concentration at 37 ◦ C. The reported saturation mass fraction of oxygen is 3.43 × 10 −5
for [58]. The unstructured model is assumed to predict metabolite uptake and production rates
when the culture is oxygen-saturated. Experimental data show the dependence of these rates on the
concentration of dissolved oxygen [59]. The reported data are used to calculate correction factors for
metabolites’ uptake and production rates at different concentrations of DO (Figure 2). Uptake and
120
of bubble vicinity is calculated using the reported average bubble diameter of 0.00289 m [53] and
assuming a particular value for critical distance from the surface of bubbles. The critical distance is
assumed to be equal to the cell radius. The number of bubbles is calculated using gas holdup in the
compartment obtained from CFD simulations and the reported value for average bubble diameter.
Average bubble lifespan is calculated using the gas holdup and air sparging flowrate. Equation (5)
shows the estimated rate of loss of cells due to interactions with bubbles under operating condition op
and in compartment c:
k d,bubbleop,c =
ln (1 −
volume o f the interaction vicinity×number o f bubblesop,c
volumec
)
bubble li f espan op,c
.
(5)
The integrated model predicts viable cell density (VCD) in compartment c using Equation (6).
μ and μ d are the metabolic rates of growth and death. They are calculated as functions of metabolites’
concentrations using the metabolic model. F sed is the rate of sedimentation. c ′ and c ′′ are compartments
below and above c. N is the total number of compartments. It can be seen that the hydrodynamic part
of Equation (6) is a linear system of independent ODEs of rank N. The discretization of space provided
by compartmental modeling allows for the application of proper orthogonal decomposition (POD) for
the development of a reduced-order model (ROM) [54]. In order to achieve this, the full rank system is
first solved to create time-series snapshots of distribution of cells over compartments under a specific
operating condition. Then a set of orthonormal bases are generated through eigen-decomposition [55].
Bases with no significant impact on the solution profile are truncated to obtain the reduced rank
model. A system with N = 16 was used to evaluate the performance of the ROM developed with
this methodology. The ROM showed satisfactory performance, while the reduction in the rank of the
system was small. The impact of the initial condition used for generating snapshots became apparent
when fewer basis functions were used for approximation. For large reactors with a greater number of
compartments, however, it is recommended to investigate the application of this methodology.
dXc
dt =
μ − μ d − k d,shearop,c + k d,bubbleop,c − F sed
c ′ ,c −
∑
N
i=1 F i,c
ρ l .volumec
X c
+F sed
c,c ′′ X c ′′ +
N
∑
i=1
F c,i
ρ l .volumec X i
(6)
Contrary to cells, metabolites are assumed to be homogenously distributed at all times. This is
due to the fact that fast diffusion dominates mass transfer in the small reactor considered for case
study. For larger bioreactors, local diffusive mass transfer has lower importance relative to convection,
so the flux matrix may be used for calculation of distribution of metabolites [18]. The dissolved
oxygen (DO) concentration is also assumed to be homogenously distributed. In the calculation of DO
concentration, mass transfer and cellular uptake are considered. The ratio of rates of oxygen uptake to
carbon dioxide production by cells has been reported to vary within a narrow range around 1 [56].
So the oxygen uptake rate (OUR) is assumed to be 0.35 pmol·cell −1 ·h −1 , which has been reported for
carbon dioxide production [57]. The overall volumetric mass transfer coefficient, k L a, is calculated
using Equation (7), in which U G op,q is superficial gas velocity (m/s) for computational cell q under
operating condition op [33]. Volumetric mass transfer coefficient is the product of liquid phase mass
transfer coefficient; k L (m/s) and specific interfacial area; a (m 2 ·m −3 ). Mass transfer stops after reaching
the saturation concentration at 37 ◦ C. The reported saturation mass fraction of oxygen is 3.43 × 10 −5
for [58]. The unstructured model is assumed to predict metabolite uptake and production rates
when the culture is oxygen-saturated. Experimental data show the dependence of these rates on the
concentration of dissolved oxygen [59]. The reported data are used to calculate correction factors for
metabolites’ uptake and production rates at different concentrations of DO (Figure 2). Uptake and
120