

133
Plant-Microbe Associations
7.4 Changing of Soil Microbial Communities during
Miscanthus Production at the Contaminated Military Land
The soil from the former military site (Sliač, Slovakia) contaminated by
different trace elements was under investigation. M. × giganteus showed
good growth in this soil during two vegetation seasons (Pidlisnyuk et al.,
2018). The changes in soil microbial community, physiological state of soil
microorganisms, and metabolic activities were investigated; rhizosphere and
bulk soils were distinguished from each other (Nebeská et al., 2018).
During two-years growing period, the most significant changes could
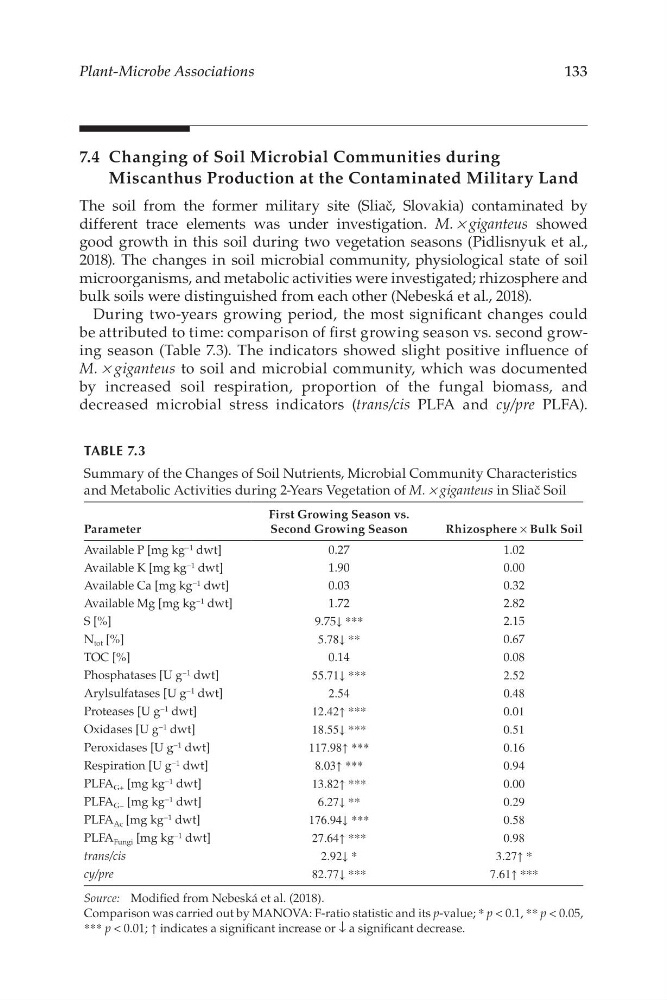
be attributed to time: comparison of first growing season vs. second growing season (Table 7.3). The indicators showed slight positive influence of
M. × giganteus to soil and microbial community, which was documented
by increased soil respiration, proportion of the fungal biomass, and
decreased microbial stress indicators (trans/cis PLFA and cy/pre PLFA).
TABLE 7.3
Summary of the Changes of Soil Nutrients, Microbial Community Characteristics
and Metabolic Activities during 2-Years Vegetation of M. × giganteus in Sliač Soil
Parameter
First Growing Season vs.
Second Growing Season
Rhizosphere × Bulk Soil
Available P [mg kg −1 dwt]
0.27
1.02
Available K [mg kg −1 dwt]
1.90
0.00
Available Ca [mg kg −1 dwt]
0.03
0.32
Available Mg [mg kg −1 dwt]
1.72
2.82
S [%]
9.75↓ ***
2.15
N tot [%]
5.78↓ **
0.67
TOC [%]
0.14
0.08
Phosphatases [U g −1 dwt]
55.71↓ ***
2.52
Arylsulfatases [U g −1 dwt]
2.54
0.48
Proteases [U g −1 dwt]
12.42↑ ***
0.01
Oxidases [U g −1 dwt]
18.55↓ ***
0.51
Peroxidases [U g −1 dwt]
117.98↑ ***
0.16
Respiration [U g −1 dwt]
8.03↑ ***
0.94
PLFA G+ [mg kg −1 dwt]
13.82↑ ***
0.00
PLFA G− [mg kg −1 dwt]
6.27↓ **
0.29
PLFA Ac [mg kg −1 dwt]
176.94↓ ***
0.58
PLFA Fungi [mg kg −1 dwt]
27.64↑ ***
0.98
trans/cis
2.92↓ *
3.27↑ *
cy/pre
82.77↓ ***
7.61↑ ***
Source: Modified from Nebeská et al. (2018).
Comparison was carried out by MANOVA: F-ratio statistic and its p-value; * p < 0.1, ** p < 0.05,
*** p < 0.01; ↑ indicates a significant increase or ↓ a significant decrease.
Plant-Microbe Associations
7.4 Changing of Soil Microbial Communities during
Miscanthus Production at the Contaminated Military Land
The soil from the former military site (Sliač, Slovakia) contaminated by
different trace elements was under investigation. M. × giganteus showed
good growth in this soil during two vegetation seasons (Pidlisnyuk et al.,
2018). The changes in soil microbial community, physiological state of soil
microorganisms, and metabolic activities were investigated; rhizosphere and
bulk soils were distinguished from each other (Nebeská et al., 2018).
During two-years growing period, the most significant changes could
be attributed to time: comparison of first growing season vs. second growing season (Table 7.3). The indicators showed slight positive influence of
M. × giganteus to soil and microbial community, which was documented
by increased soil respiration, proportion of the fungal biomass, and
decreased microbial stress indicators (trans/cis PLFA and cy/pre PLFA).
TABLE 7.3
Summary of the Changes of Soil Nutrients, Microbial Community Characteristics
and Metabolic Activities during 2-Years Vegetation of M. × giganteus in Sliač Soil
Parameter
First Growing Season vs.
Second Growing Season
Rhizosphere × Bulk Soil
Available P [mg kg −1 dwt]
0.27
1.02
Available K [mg kg −1 dwt]
1.90
0.00
Available Ca [mg kg −1 dwt]
0.03
0.32
Available Mg [mg kg −1 dwt]
1.72
2.82
S [%]
9.75↓ ***
2.15
N tot [%]
5.78↓ **
0.67
TOC [%]
0.14
0.08
Phosphatases [U g −1 dwt]
55.71↓ ***
2.52
Arylsulfatases [U g −1 dwt]
2.54
0.48
Proteases [U g −1 dwt]
12.42↑ ***
0.01
Oxidases [U g −1 dwt]
18.55↓ ***
0.51
Peroxidases [U g −1 dwt]
117.98↑ ***
0.16
Respiration [U g −1 dwt]
8.03↑ ***
0.94
PLFA G+ [mg kg −1 dwt]
13.82↑ ***
0.00
PLFA G− [mg kg −1 dwt]
6.27↓ **
0.29
PLFA Ac [mg kg −1 dwt]
176.94↓ ***
0.58
PLFA Fungi [mg kg −1 dwt]
27.64↑ ***
0.98
trans/cis
2.92↓ *
3.27↑ *
cy/pre
82.77↓ ***
7.61↑ ***
Source: Modified from Nebeská et al. (2018).
Comparison was carried out by MANOVA: F-ratio statistic and its p-value; * p < 0.1, ** p < 0.05,
*** p < 0.01; ↑ indicates a significant increase or ↓ a significant decrease.