

80
Xenopus
FIGURE 7.1 (Continued)
(l), lateral; lgo, late gastrula organizer; m, domain of primary neurogenesis adjacent to the midline; me, future mesencephalon; mhb,
midbrain/hindbrain boundary; ncc, neural crest cells; ncb, neural crest boundaries; nb, neural border; nimz, non-involuting marginal
zone; np, neural plate; npe, neural plate edge; (p), posterior; pm, prechordal mesoderm; psms, presomitic mesoderm stripe (indicative of
somitogenesis); ppe, pre-placodal ectoderm; psm, pre-somitic mesoderm; prhc, prospective hypochord; prngb, prospective neural groove
border; (s), superfcial layer; Veg, vegetal; t, trigeminal ganglion. D. Expression of Notch pathway genes during Xenopus somitogenesis.
Upper diagram: summary of the somitogenesis domains (left) and the expression of Notch pathway genes compared with RA and FGF/
Wnt opposite gradients and other relevant segmentation genes discussed in the text (right) (adapted from Sparrow, 2008, with additional
information from references listed in Table 7.12 and Kondow et al., 2007; Hitachi et al., 2008; Hitachi et al., 2009; Goda et al., 2009).
Before segmentation, Xenopus myotomal cells form a parallel array that lies perpendicular to the embryonic long axis and undergoes a
90-degree rotation associated with the appearance of the intersegmental furrow during segmentation (left). A consistent nomenclature
for somitogenesis domains and the distinct phases of cyclic gene expression in the presomitic mesoderm (PSM) was conventionally
adopted for all vertebrate species (Pourquié and Tam, 2001) (right). In the already segmented paraxial mesoderm, somites are numbered
with Roman numerals, with SI the most recently formed one. S0 is the most anterior presumptive somite in the PSM, which is about to be
segmented, followed caudally by prospective somites sequentially numbered with negative Roman numerals. Borders between prospective somites (B) are numbered with negative Arabic numerals, with B0 the intersegmental fssure between SI and the PSM (Pourquié and
Tam, 2001). The PSM is divided into three regions, according to gene expression patterns. The region encompassing S0 to S-II is known
as the somitomere region; S-III and S-IV make up the transition zone (TZ); caudal to the TZ is the tailbud domain (TBD), populated by
immature paraxial mesoderm cells (Moreno and Kintner, 2004; Sparrow, 2008). As the embryo elongates caudally, new paraxial cells
are produced at the caudal tip of the TBD and are displaced anteriorly (arrows), gradually occupying the TZ, then forming somitomeres
(S-III through S0) and fnally segregating as a mature somite (S1) from the anterior end of the PSM. Gene expression domains are shown
with black/gray bars. Known oscillating behavior is indicated by a circle with double arrows. When the expression of a gene was not
studied with enough detail to assign a precise location, asterisks indicate their approximate expression. See Table 7.12 for more details.
Lower diagrams: typical expression phases of the oscillatory genes dlc and hes5.6 in the Xenopus PSM.
Source: Adapted from Durston et al. (2018), Kirby et al. (2003).
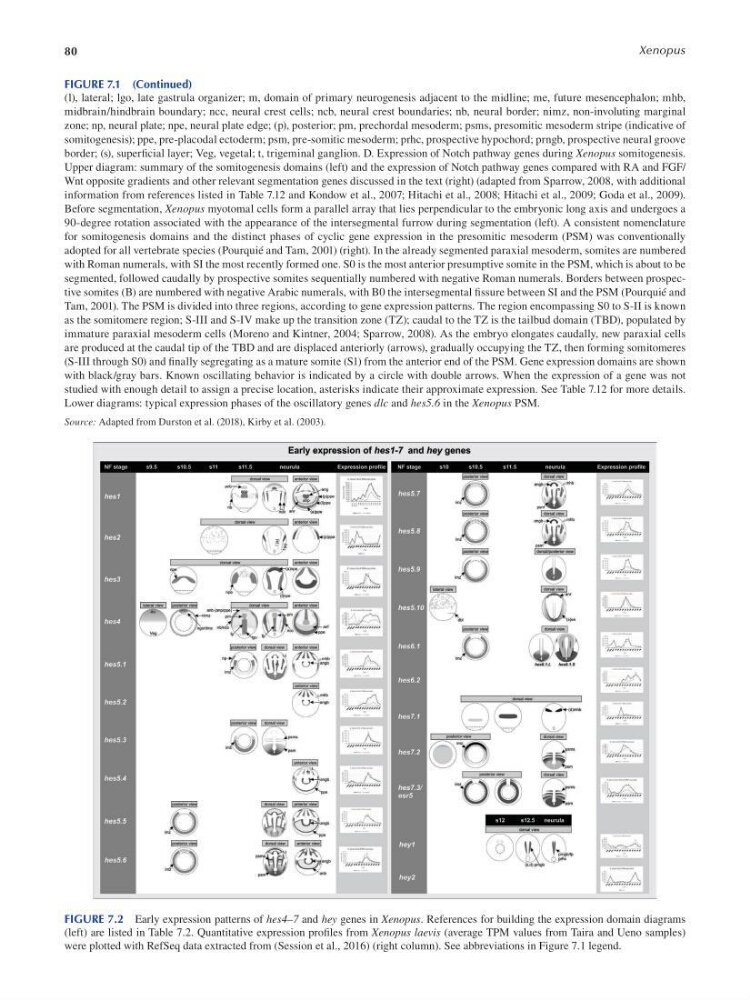
FIGURE 7.2 Early expression patterns of hes4–7 and hey genes in Xenopus. References for building the expression domain diagrams
(left) are listed in Table 7.2 . Quantitative expression profles from Xenopus laevis (average TPM values from Taira and Ueno samples)
were plotted with RefSeq data extracted from ( Session et al., 2016 ) (right column). See abbreviations in Figure 7.1 legend.
Xenopus
FIGURE 7.1 (Continued)
(l), lateral; lgo, late gastrula organizer; m, domain of primary neurogenesis adjacent to the midline; me, future mesencephalon; mhb,
midbrain/hindbrain boundary; ncc, neural crest cells; ncb, neural crest boundaries; nb, neural border; nimz, non-involuting marginal
zone; np, neural plate; npe, neural plate edge; (p), posterior; pm, prechordal mesoderm; psms, presomitic mesoderm stripe (indicative of
somitogenesis); ppe, pre-placodal ectoderm; psm, pre-somitic mesoderm; prhc, prospective hypochord; prngb, prospective neural groove
border; (s), superfcial layer; Veg, vegetal; t, trigeminal ganglion. D. Expression of Notch pathway genes during Xenopus somitogenesis.
Upper diagram: summary of the somitogenesis domains (left) and the expression of Notch pathway genes compared with RA and FGF/
Wnt opposite gradients and other relevant segmentation genes discussed in the text (right) (adapted from Sparrow, 2008, with additional
information from references listed in Table 7.12 and Kondow et al., 2007; Hitachi et al., 2008; Hitachi et al., 2009; Goda et al., 2009).
Before segmentation, Xenopus myotomal cells form a parallel array that lies perpendicular to the embryonic long axis and undergoes a
90-degree rotation associated with the appearance of the intersegmental furrow during segmentation (left). A consistent nomenclature
for somitogenesis domains and the distinct phases of cyclic gene expression in the presomitic mesoderm (PSM) was conventionally
adopted for all vertebrate species (Pourquié and Tam, 2001) (right). In the already segmented paraxial mesoderm, somites are numbered
with Roman numerals, with SI the most recently formed one. S0 is the most anterior presumptive somite in the PSM, which is about to be
segmented, followed caudally by prospective somites sequentially numbered with negative Roman numerals. Borders between prospective somites (B) are numbered with negative Arabic numerals, with B0 the intersegmental fssure between SI and the PSM (Pourquié and
Tam, 2001). The PSM is divided into three regions, according to gene expression patterns. The region encompassing S0 to S-II is known
as the somitomere region; S-III and S-IV make up the transition zone (TZ); caudal to the TZ is the tailbud domain (TBD), populated by
immature paraxial mesoderm cells (Moreno and Kintner, 2004; Sparrow, 2008). As the embryo elongates caudally, new paraxial cells
are produced at the caudal tip of the TBD and are displaced anteriorly (arrows), gradually occupying the TZ, then forming somitomeres
(S-III through S0) and fnally segregating as a mature somite (S1) from the anterior end of the PSM. Gene expression domains are shown
with black/gray bars. Known oscillating behavior is indicated by a circle with double arrows. When the expression of a gene was not
studied with enough detail to assign a precise location, asterisks indicate their approximate expression. See Table 7.12 for more details.
Lower diagrams: typical expression phases of the oscillatory genes dlc and hes5.6 in the Xenopus PSM.
Source: Adapted from Durston et al. (2018), Kirby et al. (2003).
FIGURE 7.2 Early expression patterns of hes4–7 and hey genes in Xenopus. References for building the expression domain diagrams
(left) are listed in Table 7.2 . Quantitative expression profles from Xenopus laevis (average TPM values from Taira and Ueno samples)
were plotted with RefSeq data extracted from ( Session et al., 2016 ) (right column). See abbreviations in Figure 7.1 legend.