

Analytica Chimica Acta, accepted, 07/07/2015. This is the accepted version without proofing
corrections. DOI: 10.1016/j.aca.2015.06.011
.
Page 11 of 26
HH
VV
HV
VH
Comp. Ex* Em*
Fit
(%X)
§
Ex
Em
Fit
(%X)
§
Ex
Em
Fit
(%X)
§
Ex
Em
Fit
(%X)
§
1b
298
340
38.4
297
337
17.7
296 338
25.52
298
337
30.8
1a
298
340
32.9
298
338
13.2
296 338
21.12
297
338
31.7
2b
300
324
14.4
300
324
9.6
300 324
8.98
300
324
14.3
2a
300
326
15.6
300
326
8.8
300 326
8.65
300
326
16.1
3b
296,
338
444
7.4
300,
340
454
21.9
297,
338
460
18.87
298,
338
444
7.6
3a
298,
340
448
15.4
342
460
43.1
298,
338
460
34.93
298,
338
446
15.7
4b
296
352
39.6
298
354
50.5
298 358
46.42
296
352
47.2
4a
296
350
35.9
296
348
34.4
296 352
34.76
296
350
36.2
* Ex and Em represent the peak maxima in the recovered excitation and emission profiles from the MCR model. Δλ
represents the difference between λ em and λ ex , and the maximum emission wavelengths were calculated accordingly).
§ Fit %X is the %var captured by each MCR model component (the sum-squared signal relative to the total signal in the data.
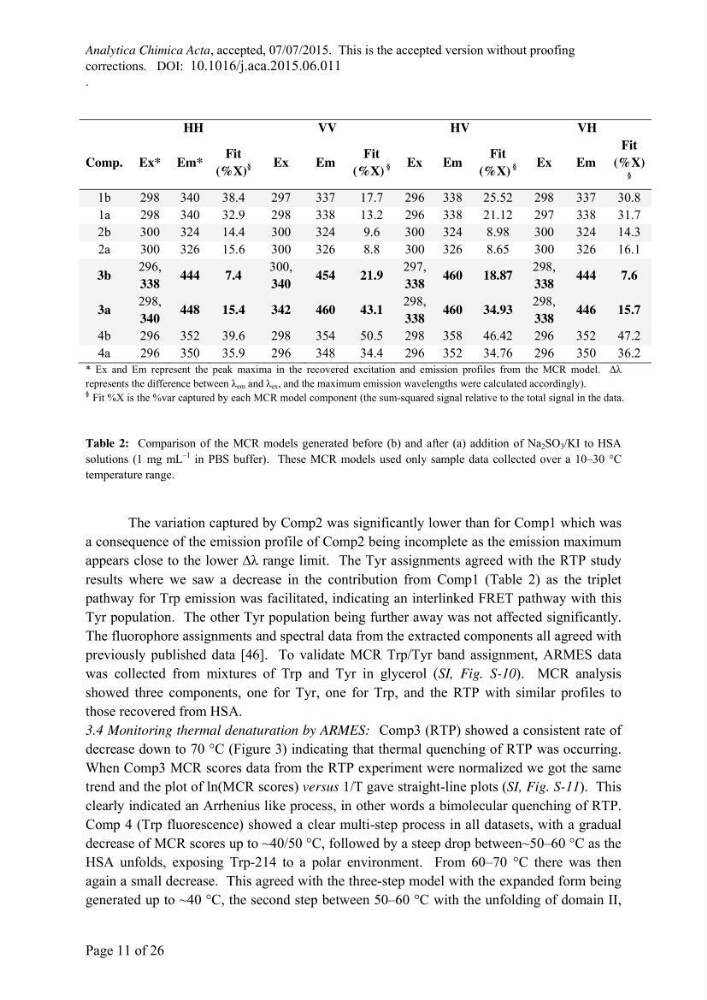
Table 2: Comparison of the MCR models generated before (b) and after (a) addition of Na 2 SO 3 /KI to HSA
solutions (1 mg mL
–1 in PBS buffer). These MCR models used only sample data collected over a 10–30 °C
temperature range.
The variation captured by Comp2 was significantly lower than for Comp1 which was
a consequence of the emission profile of Comp2 being incomplete as the emission maximum
appears close to the lower ∆λ range limit. The Tyr assignments agreed with the RTP study
results where we saw a decrease in the contribution from Comp1 (Table 2) as the triplet
pathway for Trp emission was facilitated, indicating an interlinked FRET pathway with this
Tyr population. The other Tyr population being further away was not affected significantly.
The fluorophore assignments and spectral data from the extracted components all agreed with
previously published data [46]. To validate MCR Trp/Tyr band assignment, ARMES data
was collected from mixtures of Trp and Tyr in glycerol (SI, Fig. S-10). MCR analysis
showed three components, one for Tyr, one for Trp, and the RTP with similar profiles to
those recovered from HSA.
3.4 Monitoring thermal denaturation by ARMES: Comp3 (RTP) showed a consistent rate of
decrease down to 70 °C (Figure 3) indicating that thermal quenching of RTP was occurring.
When Comp3 MCR scores data from the RTP experiment were normalized we got the same
trend and the plot of ln(MCR scores) versus 1/T gave straight-line plots (SI, Fig. S-11). This
clearly indicated an Arrhenius like process, in other words a bimolecular quenching of RTP.
Comp 4 (Trp fluorescence) showed a clear multi-step process in all datasets, with a gradual
decrease of MCR scores up to ~40/50 °C, followed by a steep drop between~50–60 °C as the
HSA unfolds, exposing Trp-214 to a polar environment. From 60–70 °C there was then
again a small decrease. This agreed with the three-step model with the expanded form being
generated up to ~40 °C, the second step between 50–60 °C with the unfolding of domain II,
corrections. DOI: 10.1016/j.aca.2015.06.011
.
Page 11 of 26
HH
VV
HV
VH
Comp. Ex* Em*
Fit
(%X)
§
Ex
Em
Fit
(%X)
§
Ex
Em
Fit
(%X)
§
Ex
Em
Fit
(%X)
§
1b
298
340
38.4
297
337
17.7
296 338
25.52
298
337
30.8
1a
298
340
32.9
298
338
13.2
296 338
21.12
297
338
31.7
2b
300
324
14.4
300
324
9.6
300 324
8.98
300
324
14.3
2a
300
326
15.6
300
326
8.8
300 326
8.65
300
326
16.1
3b
296,
338
444
7.4
300,
340
454
21.9
297,
338
460
18.87
298,
338
444
7.6
3a
298,
340
448
15.4
342
460
43.1
298,
338
460
34.93
298,
338
446
15.7
4b
296
352
39.6
298
354
50.5
298 358
46.42
296
352
47.2
4a
296
350
35.9
296
348
34.4
296 352
34.76
296
350
36.2
* Ex and Em represent the peak maxima in the recovered excitation and emission profiles from the MCR model. Δλ
represents the difference between λ em and λ ex , and the maximum emission wavelengths were calculated accordingly).
§ Fit %X is the %var captured by each MCR model component (the sum-squared signal relative to the total signal in the data.
Table 2: Comparison of the MCR models generated before (b) and after (a) addition of Na 2 SO 3 /KI to HSA
solutions (1 mg mL
–1 in PBS buffer). These MCR models used only sample data collected over a 10–30 °C
temperature range.
The variation captured by Comp2 was significantly lower than for Comp1 which was
a consequence of the emission profile of Comp2 being incomplete as the emission maximum
appears close to the lower ∆λ range limit. The Tyr assignments agreed with the RTP study
results where we saw a decrease in the contribution from Comp1 (Table 2) as the triplet
pathway for Trp emission was facilitated, indicating an interlinked FRET pathway with this
Tyr population. The other Tyr population being further away was not affected significantly.
The fluorophore assignments and spectral data from the extracted components all agreed with
previously published data [46]. To validate MCR Trp/Tyr band assignment, ARMES data
was collected from mixtures of Trp and Tyr in glycerol (SI, Fig. S-10). MCR analysis
showed three components, one for Tyr, one for Trp, and the RTP with similar profiles to
those recovered from HSA.
3.4 Monitoring thermal denaturation by ARMES: Comp3 (RTP) showed a consistent rate of
decrease down to 70 °C (Figure 3) indicating that thermal quenching of RTP was occurring.
When Comp3 MCR scores data from the RTP experiment were normalized we got the same
trend and the plot of ln(MCR scores) versus 1/T gave straight-line plots (SI, Fig. S-11). This
clearly indicated an Arrhenius like process, in other words a bimolecular quenching of RTP.
Comp 4 (Trp fluorescence) showed a clear multi-step process in all datasets, with a gradual
decrease of MCR scores up to ~40/50 °C, followed by a steep drop between~50–60 °C as the
HSA unfolds, exposing Trp-214 to a polar environment. From 60–70 °C there was then
again a small decrease. This agreed with the three-step model with the expanded form being
generated up to ~40 °C, the second step between 50–60 °C with the unfolding of domain II,