

Analytica Chimica Acta, accepted, 07/07/2015. This is the accepted version without proofing
corrections. DOI: 10.1016/j.aca.2015.06.011
.
Page 12 of 26
followed by complete, irreversible unfolding at temperatures above ~60 °C [17, 18, 48-50].
Comp1/2 displayed similar yet non-identical changes in normalized MCR scores, signifying
the different locations of the Tyr residues contributing to each signal. Comp1 (Tyr in
subdomain IIB) scores changes were closer in profile to Comp4, which may be due to the
closeness of the IIA and IIB subdomains, and the resulting change in FRET efficiencies. Tyr
residues located in the more hydrophobic IA/IB/IIIA domains (Comp2) show the least
dramatic changes, and weakest intensities because of their relatively low quantum yields.
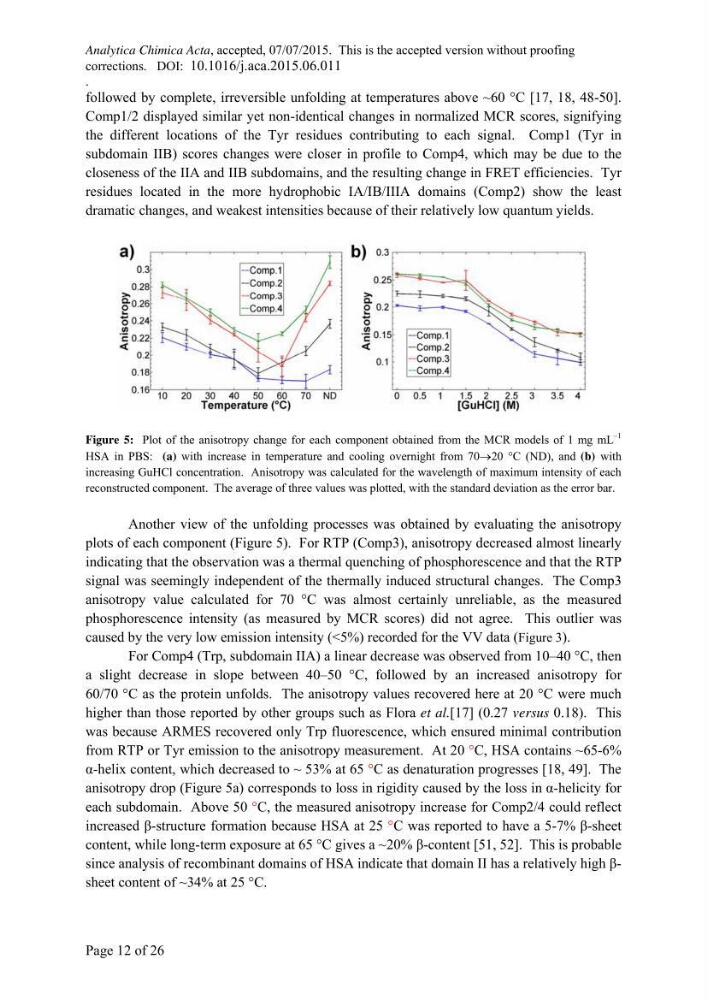
Figure 5: Plot of the anisotropy change for each component obtained from the MCR models of 1 mg mL
–1
HSA in PBS: (a) with increase in temperature and cooling overnight from 7020 °C (ND), and (b) with
increasing GuHCl concentration. Anisotropy was calculated for the wavelength of maximum intensity of each
reconstructed component. The average of three values was plotted, with the standard deviation as the error bar.
Another view of the unfolding processes was obtained by evaluating the anisotropy
plots of each component (Figure 5). For RTP (Comp3), anisotropy decreased almost linearly
indicating that the observation was a thermal quenching of phosphorescence and that the RTP
signal was seemingly independent of the thermally induced structural changes. The Comp3
anisotropy value calculated for 70 °C was almost certainly unreliable, as the measured
phosphorescence intensity (as measured by MCR scores) did not agree. This outlier was
caused by the very low emission intensity (<5%) recorded for the VV data (Figure 3).
For Comp4 (Trp, subdomain IIA) a linear decrease was observed from 10–40 °C, then
a slight decrease in slope between 40–50 °C, followed by an increased anisotropy for
60/70 °C as the protein unfolds. The anisotropy values recovered here at 20 °C were much
higher than those reported by other groups such as Flora et al.[17] (0.27 versus 0.18). This
was because ARMES recovered only Trp fluorescence, which ensured minimal contribution
from RTP or Tyr emission to the anisotropy measurement. At 20 °C, HSA contains ~65-6%
α-helix content, which decreased to ~ 53% at 65 °C as denaturation progresses [18, 49]. The
anisotropy drop (Figure 5a) corresponds to loss in rigidity caused by the loss in α-helicity for
each subdomain. Above 50 °C, the measured anisotropy increase for Comp2/4 could reflect
increased β-structure formation because HSA at 25 °C was reported to have a 5-7% β-sheet
content, while long-term exposure at 65 °C gives a ~20% β-content [51, 52]. This is probable
since analysis of recombinant domains of HSA indicate that domain II has a relatively high βsheet content of ~34% at 25 °C.
corrections. DOI: 10.1016/j.aca.2015.06.011
.
Page 12 of 26
followed by complete, irreversible unfolding at temperatures above ~60 °C [17, 18, 48-50].
Comp1/2 displayed similar yet non-identical changes in normalized MCR scores, signifying
the different locations of the Tyr residues contributing to each signal. Comp1 (Tyr in
subdomain IIB) scores changes were closer in profile to Comp4, which may be due to the
closeness of the IIA and IIB subdomains, and the resulting change in FRET efficiencies. Tyr
residues located in the more hydrophobic IA/IB/IIIA domains (Comp2) show the least
dramatic changes, and weakest intensities because of their relatively low quantum yields.
Figure 5: Plot of the anisotropy change for each component obtained from the MCR models of 1 mg mL
–1
HSA in PBS: (a) with increase in temperature and cooling overnight from 7020 °C (ND), and (b) with
increasing GuHCl concentration. Anisotropy was calculated for the wavelength of maximum intensity of each
reconstructed component. The average of three values was plotted, with the standard deviation as the error bar.
Another view of the unfolding processes was obtained by evaluating the anisotropy
plots of each component (Figure 5). For RTP (Comp3), anisotropy decreased almost linearly
indicating that the observation was a thermal quenching of phosphorescence and that the RTP
signal was seemingly independent of the thermally induced structural changes. The Comp3
anisotropy value calculated for 70 °C was almost certainly unreliable, as the measured
phosphorescence intensity (as measured by MCR scores) did not agree. This outlier was
caused by the very low emission intensity (<5%) recorded for the VV data (Figure 3).
For Comp4 (Trp, subdomain IIA) a linear decrease was observed from 10–40 °C, then
a slight decrease in slope between 40–50 °C, followed by an increased anisotropy for
60/70 °C as the protein unfolds. The anisotropy values recovered here at 20 °C were much
higher than those reported by other groups such as Flora et al.[17] (0.27 versus 0.18). This
was because ARMES recovered only Trp fluorescence, which ensured minimal contribution
from RTP or Tyr emission to the anisotropy measurement. At 20 °C, HSA contains ~65-6%
α-helix content, which decreased to ~ 53% at 65 °C as denaturation progresses [18, 49]. The
anisotropy drop (Figure 5a) corresponds to loss in rigidity caused by the loss in α-helicity for
each subdomain. Above 50 °C, the measured anisotropy increase for Comp2/4 could reflect
increased β-structure formation because HSA at 25 °C was reported to have a 5-7% β-sheet
content, while long-term exposure at 65 °C gives a ~20% β-content [51, 52]. This is probable
since analysis of recombinant domains of HSA indicate that domain II has a relatively high βsheet content of ~34% at 25 °C.