

Analytica Chimica Acta, accepted, 07/07/2015. This is the accepted version without proofing
corrections. DOI: 10.1016/j.aca.2015.06.011
.
Page 10 of 26
HH
VV
HV
VH
Comp. Ex* Em*
Fit
(%X)
§
Ex* Em*
Fit
(%X)
§
Ex*
Em*
Fit
(%X)
§
Ex*
Em*
Fit
(%X)
§
1
298 340
33.18
297
337 22.21
296
338
26.42
298
337 33.72
2
300 324
15.25
300
324 12.27
300
324
9.74
300
324 15.89
3
296,
338
444
7.55
300,
340
454 19.31
297,
338
460
19.64
298,
338
444
7.62
4
296 352
43.91
298
354 45.84
298
358
43.93
296
352 42.63
* Ex and Em represent the peak maxima in the recovered excitation and emission profiles from the MCR model.
Δλ represents the difference between λ em and λ ex , and the maximum emission wavelengths were calculated
accordingly).
§ Fit %X is the %var captured by each MCR model component (the sum-squared signal relative to the total
signal in the data.
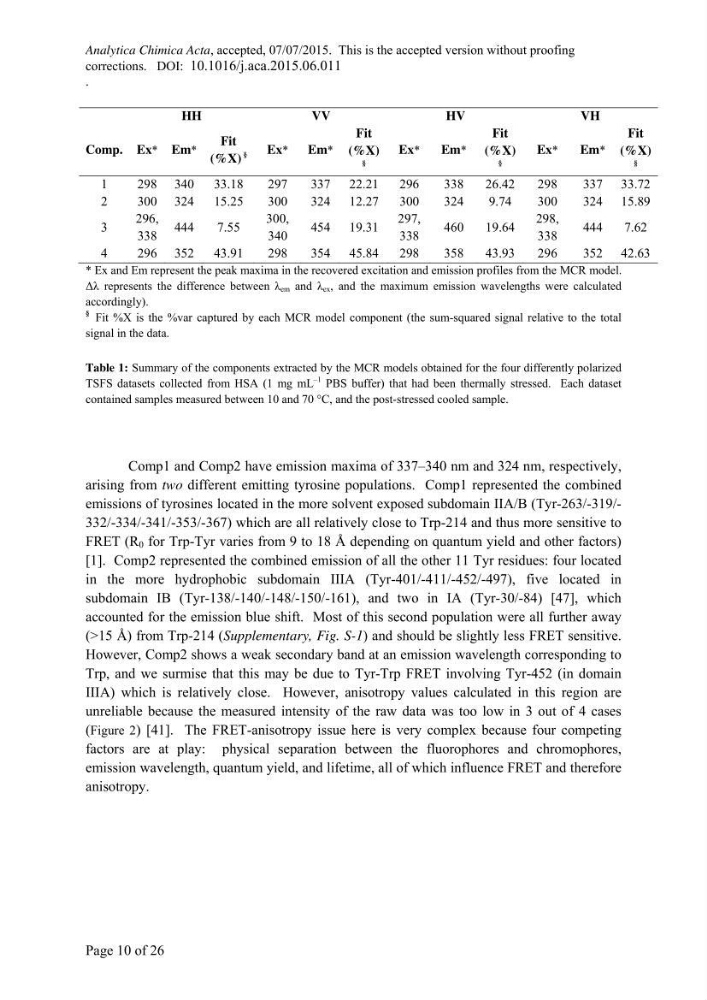
Table 1: Summary of the components extracted by the MCR models obtained for the four differently polarized
TSFS datasets collected from HSA (1 mg mL
–1 PBS buffer) that had been thermally stressed. Each dataset
contained samples measured between 10 and 70 °C, and the post-stressed cooled sample.
Comp1 and Comp2 have emission maxima of 337–340 nm and 324 nm, respectively,
arising from two different emitting tyrosine populations. Comp1 represented the combined
emissions of tyrosines located in the more solvent exposed subdomain IIA/B (Tyr-263/-319/332/-334/-341/-353/-367) which are all relatively close to Trp-214 and thus more sensitive to
FRET (R 0 for Trp-Tyr varies from 9 to 18 Å depending on quantum yield and other factors)
[1]. Comp2 represented the combined emission of all the other 11 Tyr residues: four located
in the more hydrophobic subdomain IIIA (Tyr-401/-411/-452/-497), five located in
subdomain IB (Tyr-138/-140/-148/-150/-161), and two in IA (Tyr-30/-84) [47], which
accounted for the emission blue shift. Most of this second population were all further away
(>15 Å) from Trp-214 (Supplementary, Fig. S-1) and should be slightly less FRET sensitive.
However, Comp2 shows a weak secondary band at an emission wavelength corresponding to
Trp, and we surmise that this may be due to Tyr-Trp FRET involving Tyr-452 (in domain
IIIA) which is relatively close. However, anisotropy values calculated in this region are
unreliable because the measured intensity of the raw data was too low in 3 out of 4 cases
(Figure 2) [41]. The FRET-anisotropy issue here is very complex because four competing
factors are at play: physical separation between the fluorophores and chromophores,
emission wavelength, quantum yield, and lifetime, all of which influence FRET and therefore
anisotropy.
corrections. DOI: 10.1016/j.aca.2015.06.011
.
Page 10 of 26
HH
VV
HV
VH
Comp. Ex* Em*
Fit
(%X)
§
Ex* Em*
Fit
(%X)
§
Ex*
Em*
Fit
(%X)
§
Ex*
Em*
Fit
(%X)
§
1
298 340
33.18
297
337 22.21
296
338
26.42
298
337 33.72
2
300 324
15.25
300
324 12.27
300
324
9.74
300
324 15.89
3
296,
338
444
7.55
300,
340
454 19.31
297,
338
460
19.64
298,
338
444
7.62
4
296 352
43.91
298
354 45.84
298
358
43.93
296
352 42.63
* Ex and Em represent the peak maxima in the recovered excitation and emission profiles from the MCR model.
Δλ represents the difference between λ em and λ ex , and the maximum emission wavelengths were calculated
accordingly).
§ Fit %X is the %var captured by each MCR model component (the sum-squared signal relative to the total
signal in the data.
Table 1: Summary of the components extracted by the MCR models obtained for the four differently polarized
TSFS datasets collected from HSA (1 mg mL
–1 PBS buffer) that had been thermally stressed. Each dataset
contained samples measured between 10 and 70 °C, and the post-stressed cooled sample.
Comp1 and Comp2 have emission maxima of 337–340 nm and 324 nm, respectively,
arising from two different emitting tyrosine populations. Comp1 represented the combined
emissions of tyrosines located in the more solvent exposed subdomain IIA/B (Tyr-263/-319/332/-334/-341/-353/-367) which are all relatively close to Trp-214 and thus more sensitive to
FRET (R 0 for Trp-Tyr varies from 9 to 18 Å depending on quantum yield and other factors)
[1]. Comp2 represented the combined emission of all the other 11 Tyr residues: four located
in the more hydrophobic subdomain IIIA (Tyr-401/-411/-452/-497), five located in
subdomain IB (Tyr-138/-140/-148/-150/-161), and two in IA (Tyr-30/-84) [47], which
accounted for the emission blue shift. Most of this second population were all further away
(>15 Å) from Trp-214 (Supplementary, Fig. S-1) and should be slightly less FRET sensitive.
However, Comp2 shows a weak secondary band at an emission wavelength corresponding to
Trp, and we surmise that this may be due to Tyr-Trp FRET involving Tyr-452 (in domain
IIIA) which is relatively close. However, anisotropy values calculated in this region are
unreliable because the measured intensity of the raw data was too low in 3 out of 4 cases
(Figure 2) [41]. The FRET-anisotropy issue here is very complex because four competing
factors are at play: physical separation between the fluorophores and chromophores,
emission wavelength, quantum yield, and lifetime, all of which influence FRET and therefore
anisotropy.