

The Application of GIS and Remote Sensing in a Spatiotemporal Analysis...
61
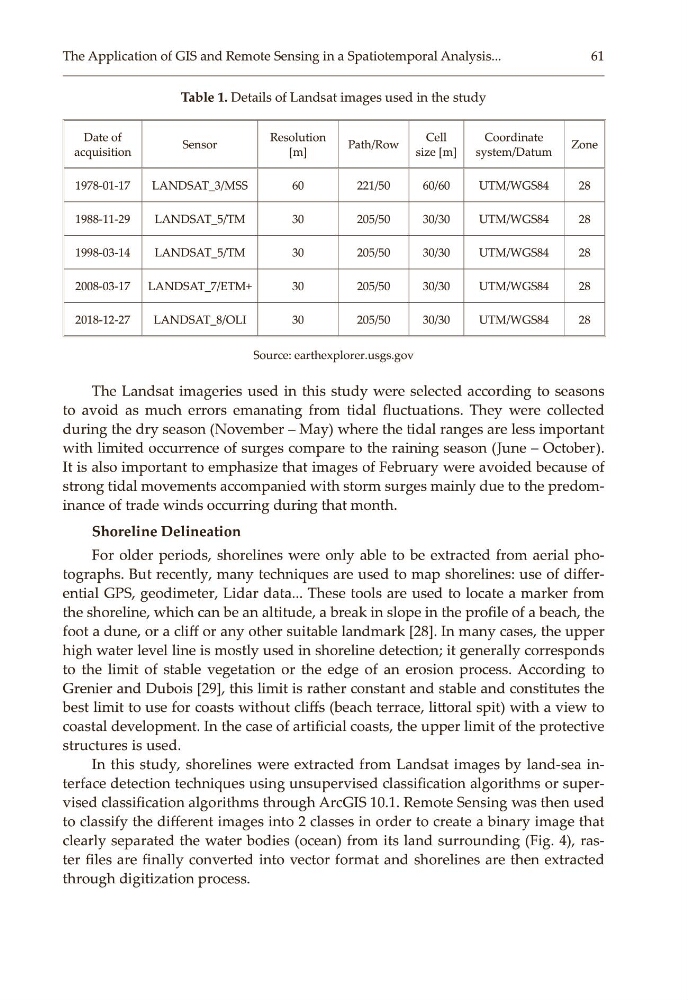
Table 1. Details of Landsat images used in the study
Date of
acquisition
Sensor
Resolution
[m]
Path/Row
Cell
size [m]
Coordinate
system/Datum
Zone
1978-01-17
LANDSAT_3/MSS
60
221/50
60/60
UTM/WGS84
28
1988-11-29
LANDSAT_5/TM
30
205/50
30/30
UTM/WGS84
28
1998-03-14
LANDSAT_5/TM
30
205/50
30/30
UTM/WGS84
28
2008-03-17
LANDSAT_7/ETM+
30
205/50
30/30
UTM/WGS84
28
2018-12-27
LANDSAT_8/OLI
30
205/50
30/30
UTM/WGS84
28
Source: earthexplorer.usgs.gov
The Landsat imageries used in this study were selected according to seasons
to avoid as much errors emanating from tidal fluctuations. They were collected
during the dry season (November – May) where the tidal ranges are less important
with limited occurrence of surges compare to the raining season (June – October).
It is also important to emphasize that images of February were avoided because of
strong tidal movements accompanied with storm surges mainly due to the predom‑
inance of trade winds occurring during that month.
Shoreline Delineation
For older periods, shorelines were only able to be extracted from aerial pho‑
tographs. But recently, many techniques are used to map shorelines: use of differ‑
ential GPS, geodimeter, Lidar data... These tools are used to locate a marker from
the shoreline, which can be an altitude, a break in slope in the profile of a beach, the
foot a dune, or a cliff or any other suitable landmark [28]. In many cases, the upper
high water level line is mostly used in shoreline detection; it generally corresponds
to the limit of stable vegetation or the edge of an erosion process. According to
Grenier and Dubois [29], this limit is rather constant and stable and constitutes the
best limit to use for coasts without cliffs (beach terrace, littoral spit) with a view to
coastal development. In the case of artificial coasts, the upper limit of the protective
structures is used.
In this study, shorelines were extracted from Landsat images by land-sea in‑
terface detection techniques using unsupervised classification algorithms or super‑
vised classification algorithms through ArcGIS 10.1. Remote Sensing was then used
to classify the different images into 2 classes in order to create a binary image that
clearly separated the water bodies (ocean) from its land surrounding (Fig. 4), ras‑
ter files are finally converted into vector format and shorelines are then extracted
through digitization process.
61
Table 1. Details of Landsat images used in the study
Date of
acquisition
Sensor
Resolution
[m]
Path/Row
Cell
size [m]
Coordinate
system/Datum
Zone
1978-01-17
LANDSAT_3/MSS
60
221/50
60/60
UTM/WGS84
28
1988-11-29
LANDSAT_5/TM
30
205/50
30/30
UTM/WGS84
28
1998-03-14
LANDSAT_5/TM
30
205/50
30/30
UTM/WGS84
28
2008-03-17
LANDSAT_7/ETM+
30
205/50
30/30
UTM/WGS84
28
2018-12-27
LANDSAT_8/OLI
30
205/50
30/30
UTM/WGS84
28
Source: earthexplorer.usgs.gov
The Landsat imageries used in this study were selected according to seasons
to avoid as much errors emanating from tidal fluctuations. They were collected
during the dry season (November – May) where the tidal ranges are less important
with limited occurrence of surges compare to the raining season (June – October).
It is also important to emphasize that images of February were avoided because of
strong tidal movements accompanied with storm surges mainly due to the predom‑
inance of trade winds occurring during that month.
Shoreline Delineation
For older periods, shorelines were only able to be extracted from aerial pho‑
tographs. But recently, many techniques are used to map shorelines: use of differ‑
ential GPS, geodimeter, Lidar data... These tools are used to locate a marker from
the shoreline, which can be an altitude, a break in slope in the profile of a beach, the
foot a dune, or a cliff or any other suitable landmark [28]. In many cases, the upper
high water level line is mostly used in shoreline detection; it generally corresponds
to the limit of stable vegetation or the edge of an erosion process. According to
Grenier and Dubois [29], this limit is rather constant and stable and constitutes the
best limit to use for coasts without cliffs (beach terrace, littoral spit) with a view to
coastal development. In the case of artificial coasts, the upper limit of the protective
structures is used.
In this study, shorelines were extracted from Landsat images by land-sea in‑
terface detection techniques using unsupervised classification algorithms or super‑
vised classification algorithms through ArcGIS 10.1. Remote Sensing was then used
to classify the different images into 2 classes in order to create a binary image that
clearly separated the water bodies (ocean) from its land surrounding (Fig. 4), ras‑
ter files are finally converted into vector format and shorelines are then extracted
through digitization process.