

500 CHAPTER 8. LABORATORY MEASUREMENT AND ANALYSIS
The Fourier transformation can be applied to the entire time series
record at once, or the record can be subdivided into several equal-length
records and analyzed separately (Welsh method). With the former technique an average is made of the spectral estimates from several adjacent
frequencies to provide more stability to the spectral estimate. In the latter
method, the spectral estimates at each frequency from all of the shorter segments are averaged. Both methods are commonly used for spectral wave
analysis. If data are collected from several adjacent wave gauges, then
cross-spectral analysis can be performed on the data to provide indications
of cross-correlation between the records.
Wave records intended for spectral analysis should be as long as possible to achieve better spectral resolution. The time interval, At, between
samples in the time series is also very important because it determines the
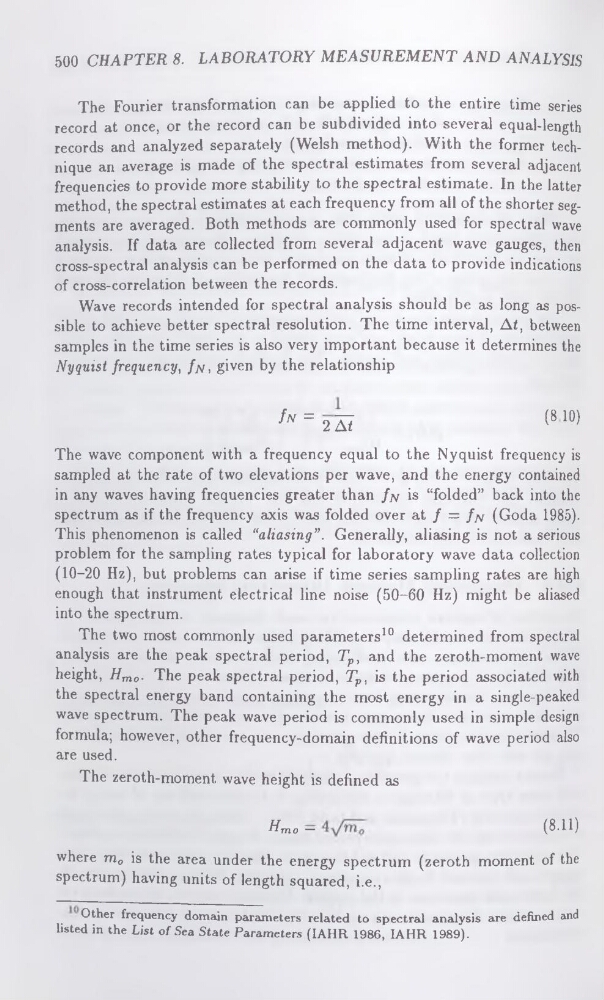
Nyquist frequency, fa, given by the relationship
f" = 2ÀÏ
<8 10>
The wave component with a frequency equal to the Nyquist frequency is
sampled at the rate of two elevations per wave, and the energy contained
in any waves having frequencies greater than fa is “folded” back into the
spectrum as if the frequency axis was folded over at f = fa (Goda 1985).
This phenomenon is called “abasing”. Generally, aliasing is not a serious
problem for the sampling rates typical for laboratory wave data collection
(10-20 Hz), but problems can arise if time series sampling rates are high
enough that instrument electrical line noise (50-60 Hz) might be aliased
into the spectrum.
The two most commonly used parameters10 determined from spectral
analysis are the peak spectral period, Tp, and the zeroth-moment wave
height, Hmo. The peak spectral period, Tp, is the period associated with
the spectral energy band containing the most energy in a single-peaked
wave spectrum. The peak wave period is commonly used in simple design
formula; however, other frequency-domain definitions of wave period also
are used.
The zeroth-moment wave height is defined as
Hmo —
(8.11)
where m0 is the area under the energy spectrum (zeroth moment of the
spectrum) having units of length squared, i.e.,
Other frequency domain parameters related to spectral analysis are defined and
listed in the List of Sea State Parameters (IAHR 1986, IAHR 1989).
The Fourier transformation can be applied to the entire time series
record at once, or the record can be subdivided into several equal-length
records and analyzed separately (Welsh method). With the former technique an average is made of the spectral estimates from several adjacent
frequencies to provide more stability to the spectral estimate. In the latter
method, the spectral estimates at each frequency from all of the shorter segments are averaged. Both methods are commonly used for spectral wave
analysis. If data are collected from several adjacent wave gauges, then
cross-spectral analysis can be performed on the data to provide indications
of cross-correlation between the records.
Wave records intended for spectral analysis should be as long as possible to achieve better spectral resolution. The time interval, At, between
samples in the time series is also very important because it determines the
Nyquist frequency, fa, given by the relationship
f" = 2ÀÏ
<8 10>
The wave component with a frequency equal to the Nyquist frequency is
sampled at the rate of two elevations per wave, and the energy contained
in any waves having frequencies greater than fa is “folded” back into the
spectrum as if the frequency axis was folded over at f = fa (Goda 1985).
This phenomenon is called “abasing”. Generally, aliasing is not a serious
problem for the sampling rates typical for laboratory wave data collection
(10-20 Hz), but problems can arise if time series sampling rates are high
enough that instrument electrical line noise (50-60 Hz) might be aliased
into the spectrum.
The two most commonly used parameters10 determined from spectral
analysis are the peak spectral period, Tp, and the zeroth-moment wave
height, Hmo. The peak spectral period, Tp, is the period associated with
the spectral energy band containing the most energy in a single-peaked
wave spectrum. The peak wave period is commonly used in simple design
formula; however, other frequency-domain definitions of wave period also
are used.
The zeroth-moment wave height is defined as
Hmo —
(8.11)
where m0 is the area under the energy spectrum (zeroth moment of the
spectrum) having units of length squared, i.e.,
Other frequency domain parameters related to spectral analysis are defined and
listed in the List of Sea State Parameters (IAHR 1986, IAHR 1989).