

8.3. WAVE DATA ANALYSIS
501
r/w
mo — /
df
dJl
(8-12)
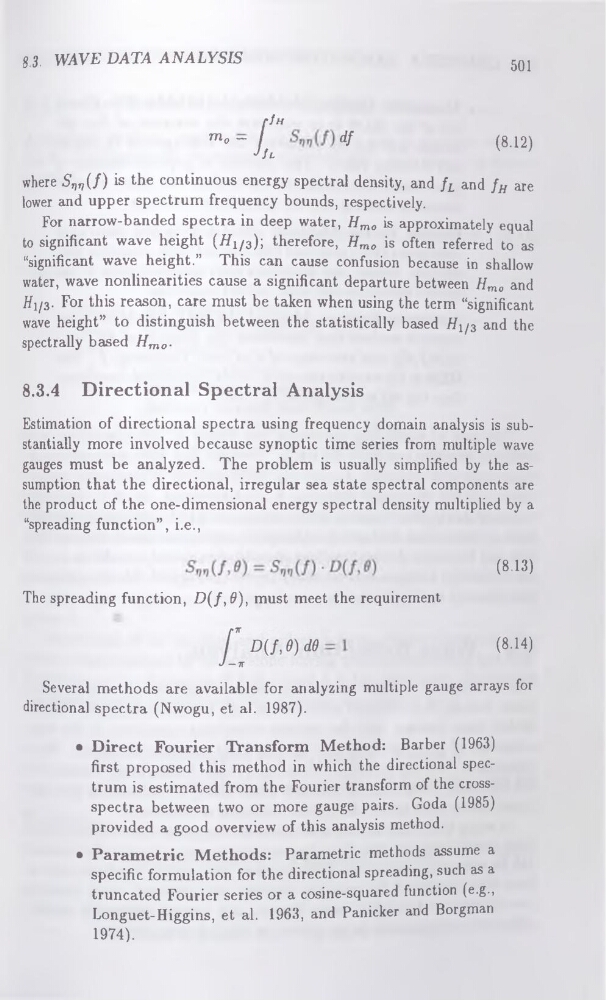
where S^f) is the continuous energy spectral density, and fL and fH are
lower and upper spectrum frequency bounds, respectively.
For narrow-banded spectra in deep water, Hmo is approximately equal
to significant wave height (Hyp)] therefore, Hmo is often referred to as
“significant wave height.” This can cause confusion because in shallow
water, wave nonlinearities cause a significant departure between Hmo and
#i/3. For this reason, care must be taken when using the term “significant
wave height” to distinguish between the statistically based Hy/3 and the
spectrally based Hmo.
8.3.4 Directional Spectral Analysis
Estimation of directional spectra using frequency domain analysis is substantially more involved because synoptic time series from multiple wave
gauges must be analyzed. The problem is usually simplified by the assumption that the directional, irregular sea state spectral components are
the product of the one-dimensional energy spectral density multiplied by a
“spreading function”, i.e.,
(8.13)
The spreading function, D(f,d), must meet the requirement
(8-14)
Several methods are available for analyzing multiple gauge arrays for
directional spectra (Nwogu, et al. 1987).
• Direct Fourier Transform Method: Barber (1963)
first proposed this method in which the directional spectrum is estimated from the Fourier transform of the crossspectra between two or more gauge pairs. Goda (1985)
provided a good overview of this analysis method.
• Parametric Methods: Parametric methods assume a
specific formulation for the directional spreading, such as a
truncated Fourier series or a cosine-squared function (e.g.,
Longuet-Higgins, et al. 1963, and Panicker and Borgman
1974).
501
r/w
mo — /
df
dJl
(8-12)
where S^f) is the continuous energy spectral density, and fL and fH are
lower and upper spectrum frequency bounds, respectively.
For narrow-banded spectra in deep water, Hmo is approximately equal
to significant wave height (Hyp)] therefore, Hmo is often referred to as
“significant wave height.” This can cause confusion because in shallow
water, wave nonlinearities cause a significant departure between Hmo and
#i/3. For this reason, care must be taken when using the term “significant
wave height” to distinguish between the statistically based Hy/3 and the
spectrally based Hmo.
8.3.4 Directional Spectral Analysis
Estimation of directional spectra using frequency domain analysis is substantially more involved because synoptic time series from multiple wave
gauges must be analyzed. The problem is usually simplified by the assumption that the directional, irregular sea state spectral components are
the product of the one-dimensional energy spectral density multiplied by a
“spreading function”, i.e.,
(8.13)
The spreading function, D(f,d), must meet the requirement
(8-14)
Several methods are available for analyzing multiple gauge arrays for
directional spectra (Nwogu, et al. 1987).
• Direct Fourier Transform Method: Barber (1963)
first proposed this method in which the directional spectrum is estimated from the Fourier transform of the crossspectra between two or more gauge pairs. Goda (1985)
provided a good overview of this analysis method.
• Parametric Methods: Parametric methods assume a
specific formulation for the directional spreading, such as a
truncated Fourier series or a cosine-squared function (e.g.,
Longuet-Higgins, et al. 1963, and Panicker and Borgman
1974).