

8.3. WAVE DATA ANALYSIS
499
#1/3 - significant wave height (which is the average
of the highest 1/3 of the waves in the record)
Umax - maximum wave height in the record
71/3 - average period of the highest 1/3 of the waves
in the record
There are numerous other time domain statistics that can be determined from time series of sea surface elevation. Standard definitions and
notation for practically all wave parameters were established and published
by a working group of the International Association of Hydraulic Research
(IAHR 1986, IAHR 1989).
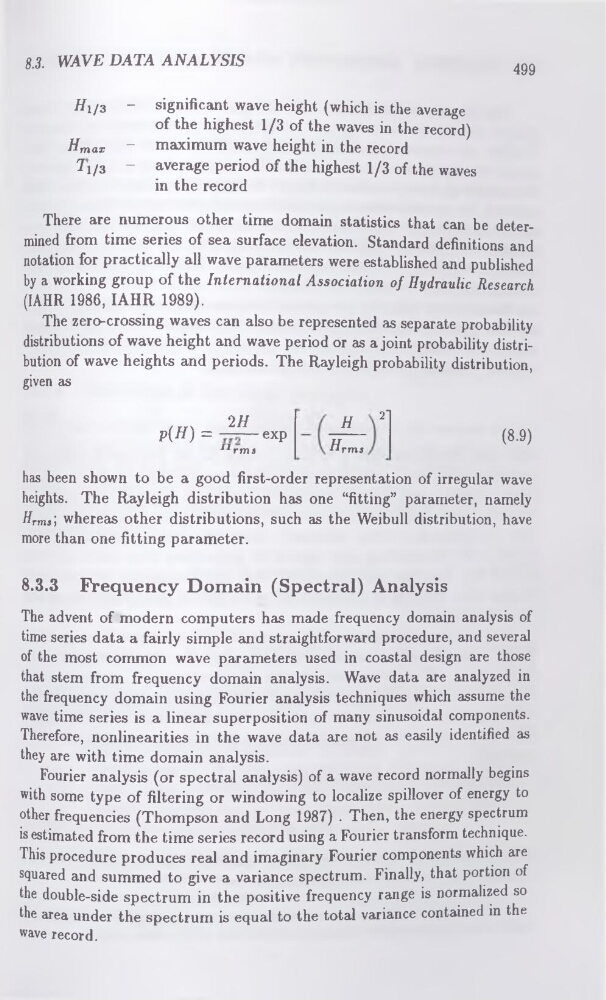
The zero-crossing waves can also be represented as separate probability
distributions of wave height and wave period or as a joint probability distribution of wave heights and periods. The Rayleigh probability distribution,
given as
zrrx
2/f
P(H) =
exP
^rms
H
Urms
2"
(8-9)
has been shown to be a good first-order representation of irregular wave
heights. The Rayleigh distribution has one “fitting” parameter, namely
Hrms'y whereas other distributions, such as the Weibull distribution, have
more than one fitting parameter.
8.3.3 Frequency Domain (Spectral) Analysis
The advent of modern computers has made frequency domain analysis of
time series data a fairly simple and straightforward procedure, and several
of the most common wave parameters used in coastal design are those
that stem from frequency domain analysis. Wave data are analyzed in
the frequency domain using Fourier analysis techniques which assume the
wave time series is a linear superposition of many sinusoidal components.
Therefore, nonlinearities in the wave data are not as easily identified as
they are with time domain analysis.
Fourier analysis (or spectral analysis) of a wave record normally begins
with some type of filtering or windowing to localize spillover of energy to
other frequencies (Thompson and Long 1987) . Then, the energy spectrum
is estimated from the time series record using a Fourier transform technique.
This procedure produces real and imaginary Fourier components which are
squared and summed to give a variance spectrum. Finally, that portion of
the double-side spectrum in the positive frequency range is normalized so
the area under the spectrum is equal to the total variance contained in the
wave record.
499
#1/3 - significant wave height (which is the average
of the highest 1/3 of the waves in the record)
Umax - maximum wave height in the record
71/3 - average period of the highest 1/3 of the waves
in the record
There are numerous other time domain statistics that can be determined from time series of sea surface elevation. Standard definitions and
notation for practically all wave parameters were established and published
by a working group of the International Association of Hydraulic Research
(IAHR 1986, IAHR 1989).
The zero-crossing waves can also be represented as separate probability
distributions of wave height and wave period or as a joint probability distribution of wave heights and periods. The Rayleigh probability distribution,
given as
zrrx
2/f
P(H) =
exP
^rms
H
Urms
2"
(8-9)
has been shown to be a good first-order representation of irregular wave
heights. The Rayleigh distribution has one “fitting” parameter, namely
Hrms'y whereas other distributions, such as the Weibull distribution, have
more than one fitting parameter.
8.3.3 Frequency Domain (Spectral) Analysis
The advent of modern computers has made frequency domain analysis of
time series data a fairly simple and straightforward procedure, and several
of the most common wave parameters used in coastal design are those
that stem from frequency domain analysis. Wave data are analyzed in
the frequency domain using Fourier analysis techniques which assume the
wave time series is a linear superposition of many sinusoidal components.
Therefore, nonlinearities in the wave data are not as easily identified as
they are with time domain analysis.
Fourier analysis (or spectral analysis) of a wave record normally begins
with some type of filtering or windowing to localize spillover of energy to
other frequencies (Thompson and Long 1987) . Then, the energy spectrum
is estimated from the time series record using a Fourier transform technique.
This procedure produces real and imaginary Fourier components which are
squared and summed to give a variance spectrum. Finally, that portion of
the double-side spectrum in the positive frequency range is normalized so
the area under the spectrum is equal to the total variance contained in the
wave record.