

182
A. Accornero et al.
U - Velocity, div=2 cm/s
I -Mar-1995
l-Apr-1995
I-May-1995
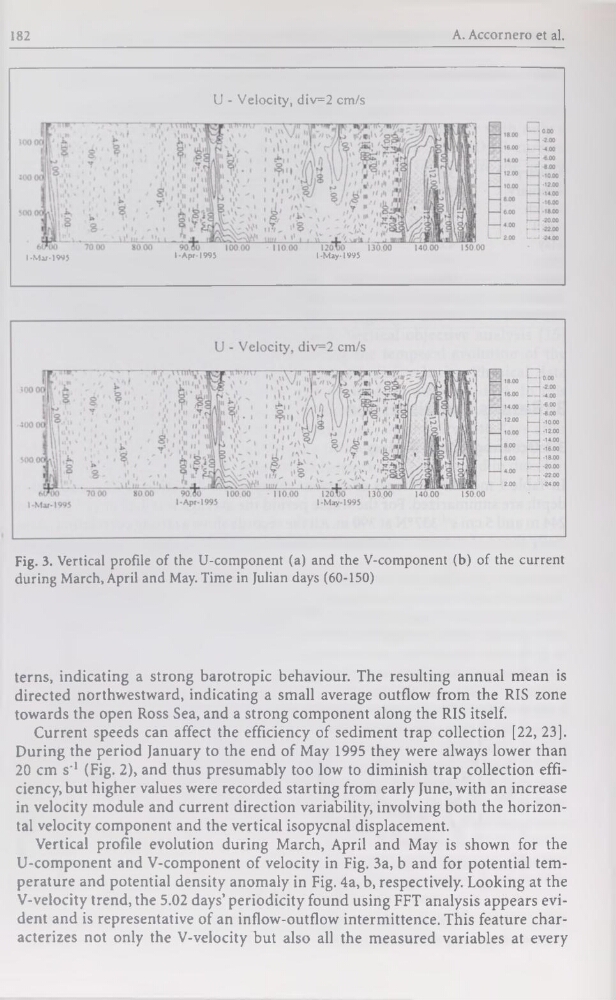
Fig. 3. Vertical profile of the U-component (a) and the V-component (b) of the current
during March, April and May. Time in Julian days (60-150)
terns, indicating a strong barotropic behaviour. The resulting annual mean is
directed northwestward, indicating a small average outflow from the RIS zone
towards the open Ross Sea, and a strong component along the RIS itself.
Current speeds can affect the efficiency of sédiment trap collection [22, 23].
During the period January to the end of May 1995 they were always lower than
20 cm s'1 (Fig. 2), and thus presumably too low to diminish trap collection efficiency, but higher values were recorded starting from early June, with an increase
in velocity module and current direction variability, involving both the horizontal velocity component and the vertical isopycnal displacement.
Vertical profile évolution during March, April and May is shown for the
U-component and V-component of velocity in Fig. 3a, b and for potential température and potential density anomaly in Fig. 4a, b, respectively. Looking at the
V-velocity trend, the 5.02 days’ periodicity found using FFT analysis appears évident and is représentative of an inflow-outflow intermittence. This feature characterizes not only the V-velocity but also ail the measured variables at every
A. Accornero et al.
U - Velocity, div=2 cm/s
I -Mar-1995
l-Apr-1995
I-May-1995
Fig. 3. Vertical profile of the U-component (a) and the V-component (b) of the current
during March, April and May. Time in Julian days (60-150)
terns, indicating a strong barotropic behaviour. The resulting annual mean is
directed northwestward, indicating a small average outflow from the RIS zone
towards the open Ross Sea, and a strong component along the RIS itself.
Current speeds can affect the efficiency of sédiment trap collection [22, 23].
During the period January to the end of May 1995 they were always lower than
20 cm s'1 (Fig. 2), and thus presumably too low to diminish trap collection efficiency, but higher values were recorded starting from early June, with an increase
in velocity module and current direction variability, involving both the horizontal velocity component and the vertical isopycnal displacement.
Vertical profile évolution during March, April and May is shown for the
U-component and V-component of velocity in Fig. 3a, b and for potential température and potential density anomaly in Fig. 4a, b, respectively. Looking at the
V-velocity trend, the 5.02 days’ periodicity found using FFT analysis appears évident and is représentative of an inflow-outflow intermittence. This feature characterizes not only the V-velocity but also ail the measured variables at every