

Current,Température and Salinity Observations in the Terra Nova Bay
169
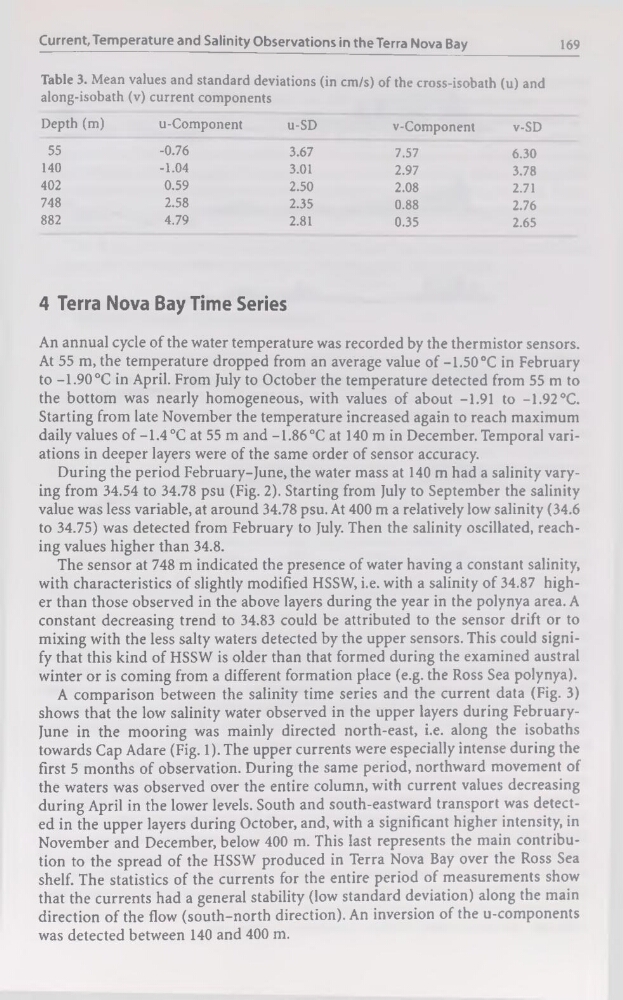
Table 3. Mean values and standard déviations (in cm/s) of the cross-isobath (u) and
along-isobath (v) current components
Depth (m)
u-Component
u-SD
v-Component
v-SD
55
-0.76
3.67
7.57
6.30
140
-1.04
3.01
2.97
3.78
402
0.59
2.50
2.08
2.71
748
2.58
2.35
0.88
2.76
882
4.79
2.81
0.35
2.65
4 Terra Nova Bay Time Sériés
An annual cycle of the water température was recorded by the thermistor sensors.
At 55 m, the température dropped from an average value of -1.50°C in February
to -1.90 °C in April. From July to October the température detected from 55 m to
the bottom was nearly homogeneous, with values of about -1.91 to -1.92 °C.
Starting from late November the température increased again to reach maximum
daily values of-1.4 °C at 55 m and -1.86 °C at 140 m in December. Temporal variations in deeper layers were of the same order of sensor accuracy.
During the period February-June, the water mass at 140 m had a salinity varying from 34.54 to 34.78 psu (Fig. 2). Starting from July to September the salinity
value was less variable, at around 34.78 psu. At 400 m a relatively low salinity (34.6
to 34.75) was detected from February to July. Then the salinity oscillated, reaching values higher than 34.8.
The sensor at 748 m indicated the presence of water having a constant salinity,
with characteristics of slightly modified HSSW, i.e. with a salinity of 34.87 higher than those observed in the above layers during the year in the polynya area. A
constant decreasing trend to 34.83 could be attributed to the sensor drift or to
mixing with the less salty waters detected by the upper sensors. This could signify that this kind of HSSW is older than that formed during the examined austral
winter or is coming from a different formation place (e.g. the Ross Sea polynya).
A comparison between the salinity time sériés and the current data (Fig. 3)
shows that the low salinity water observed in the upper layers during FebruaryJune in the mooring was mainly directed north-east, i.e. along the isobaths
towards Cap Adare (Fig. 1). The upper currents were especially intense during the
first 5 months of observation. During the same period, northward movement of
the waters was observed over the entire column, with current values decreasing
during April in the lower levels. South and south-eastward transport was detected in the upper layers during October, and, with a significant higher intensity, in
November and December, below 400 m. This last represents the main contribution to the spread of the HSSW produced in Terra Nova Bay over the Ross Sea
shelf. The statistics of the currents for the entire period of measurements show
that the currents had a general stability (low standard déviation) along the main
direction of the flow (south-north direction). An inversion of the u-components
was detected between 140 and 400 m.
169
Table 3. Mean values and standard déviations (in cm/s) of the cross-isobath (u) and
along-isobath (v) current components
Depth (m)
u-Component
u-SD
v-Component
v-SD
55
-0.76
3.67
7.57
6.30
140
-1.04
3.01
2.97
3.78
402
0.59
2.50
2.08
2.71
748
2.58
2.35
0.88
2.76
882
4.79
2.81
0.35
2.65
4 Terra Nova Bay Time Sériés
An annual cycle of the water température was recorded by the thermistor sensors.
At 55 m, the température dropped from an average value of -1.50°C in February
to -1.90 °C in April. From July to October the température detected from 55 m to
the bottom was nearly homogeneous, with values of about -1.91 to -1.92 °C.
Starting from late November the température increased again to reach maximum
daily values of-1.4 °C at 55 m and -1.86 °C at 140 m in December. Temporal variations in deeper layers were of the same order of sensor accuracy.
During the period February-June, the water mass at 140 m had a salinity varying from 34.54 to 34.78 psu (Fig. 2). Starting from July to September the salinity
value was less variable, at around 34.78 psu. At 400 m a relatively low salinity (34.6
to 34.75) was detected from February to July. Then the salinity oscillated, reaching values higher than 34.8.
The sensor at 748 m indicated the presence of water having a constant salinity,
with characteristics of slightly modified HSSW, i.e. with a salinity of 34.87 higher than those observed in the above layers during the year in the polynya area. A
constant decreasing trend to 34.83 could be attributed to the sensor drift or to
mixing with the less salty waters detected by the upper sensors. This could signify that this kind of HSSW is older than that formed during the examined austral
winter or is coming from a different formation place (e.g. the Ross Sea polynya).
A comparison between the salinity time sériés and the current data (Fig. 3)
shows that the low salinity water observed in the upper layers during FebruaryJune in the mooring was mainly directed north-east, i.e. along the isobaths
towards Cap Adare (Fig. 1). The upper currents were especially intense during the
first 5 months of observation. During the same period, northward movement of
the waters was observed over the entire column, with current values decreasing
during April in the lower levels. South and south-eastward transport was detected in the upper layers during October, and, with a significant higher intensity, in
November and December, below 400 m. This last represents the main contribution to the spread of the HSSW produced in Terra Nova Bay over the Ross Sea
shelf. The statistics of the currents for the entire period of measurements show
that the currents had a general stability (low standard déviation) along the main
direction of the flow (south-north direction). An inversion of the u-components
was detected between 140 and 400 m.