

168
G.M.R. Manzella et al.
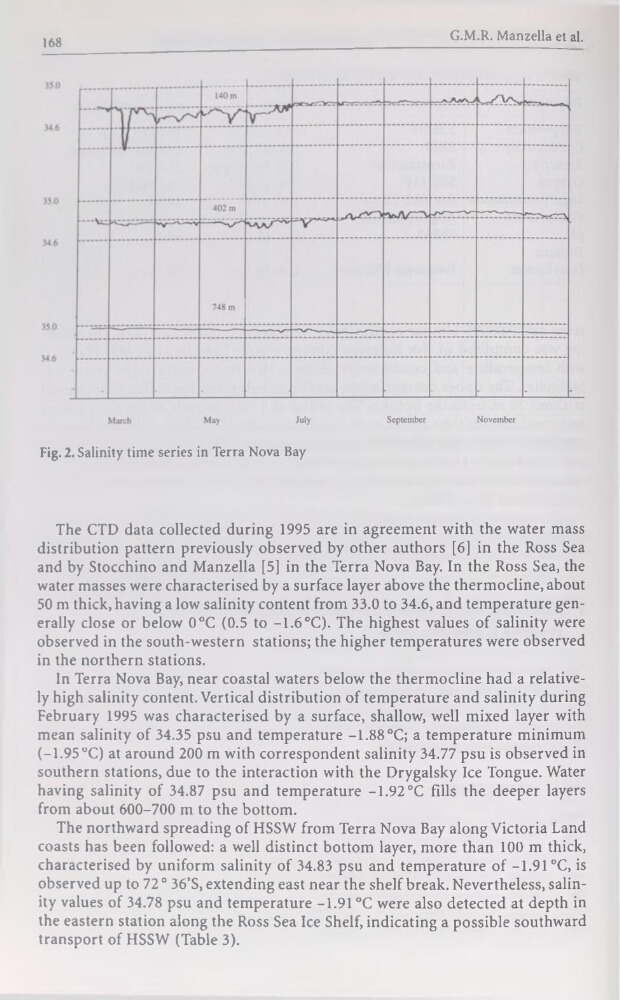
Fig. 2. Salinity time sériés in Terra Nova Bay
The CTD data collected during 1995 are in agreement with the water mass
distribution pattern previously observed by other authors [6] in the Ross Sea
and by Stocchino and Manzella [5] in the Terra Nova Bay. In the Ross Sea, the
water masses were characterised by a surface layer above the thermocline, about
50 m thick, having a low salinity content from 33.0 to 34.6, and température generally close or below 0°C (0.5 to -1.6°C). The highest values of salinity were
observed in the south-western stations; the higher températures were observed
in the northern stations.
In Terra Nova Bay, near Coastal waters below the thermocline had a relatively high salinity content. Vertical distribution of température and salinity during
February 1995 was characterised by a surface, shallow, well mixed layer with
mean salinity of 34.35 psu and température -1.88 °C; a température minimum
(-1.95 °C) at around 200 m with correspondent salinity 34.77 psu is observed in
Southern stations, due to the interaction with the Drygalsky Ice Tongue. Water
having salinity of 34.87 psu and température -1.92 °C fills the deeper layers
from about 600-700 m to the bottom.
The northward spreading of HSSW from Terra Nova Bay along Victoria Land
coasts has been followed: a well distinct bottom layer, more than 100 m thick,
characterised by uniform salinity of 34.83 psu and température of -1.91 °C, is
observed up to 72 0 36’S, extending east near the shelf break. Nevertheless, salinity values of 34.78 psu and température -1.91 °C were also detected at depth in
the eastern station along the Ross Sea Ice Shelf, indicating a possible southward
transport of HSSW (Table 3).
G.M.R. Manzella et al.
Fig. 2. Salinity time sériés in Terra Nova Bay
The CTD data collected during 1995 are in agreement with the water mass
distribution pattern previously observed by other authors [6] in the Ross Sea
and by Stocchino and Manzella [5] in the Terra Nova Bay. In the Ross Sea, the
water masses were characterised by a surface layer above the thermocline, about
50 m thick, having a low salinity content from 33.0 to 34.6, and température generally close or below 0°C (0.5 to -1.6°C). The highest values of salinity were
observed in the south-western stations; the higher températures were observed
in the northern stations.
In Terra Nova Bay, near Coastal waters below the thermocline had a relatively high salinity content. Vertical distribution of température and salinity during
February 1995 was characterised by a surface, shallow, well mixed layer with
mean salinity of 34.35 psu and température -1.88 °C; a température minimum
(-1.95 °C) at around 200 m with correspondent salinity 34.77 psu is observed in
Southern stations, due to the interaction with the Drygalsky Ice Tongue. Water
having salinity of 34.87 psu and température -1.92 °C fills the deeper layers
from about 600-700 m to the bottom.
The northward spreading of HSSW from Terra Nova Bay along Victoria Land
coasts has been followed: a well distinct bottom layer, more than 100 m thick,
characterised by uniform salinity of 34.83 psu and température of -1.91 °C, is
observed up to 72 0 36’S, extending east near the shelf break. Nevertheless, salinity values of 34.78 psu and température -1.91 °C were also detected at depth in
the eastern station along the Ross Sea Ice Shelf, indicating a possible southward
transport of HSSW (Table 3).