

S.S. Jacobs, C.F. Giulivi
6
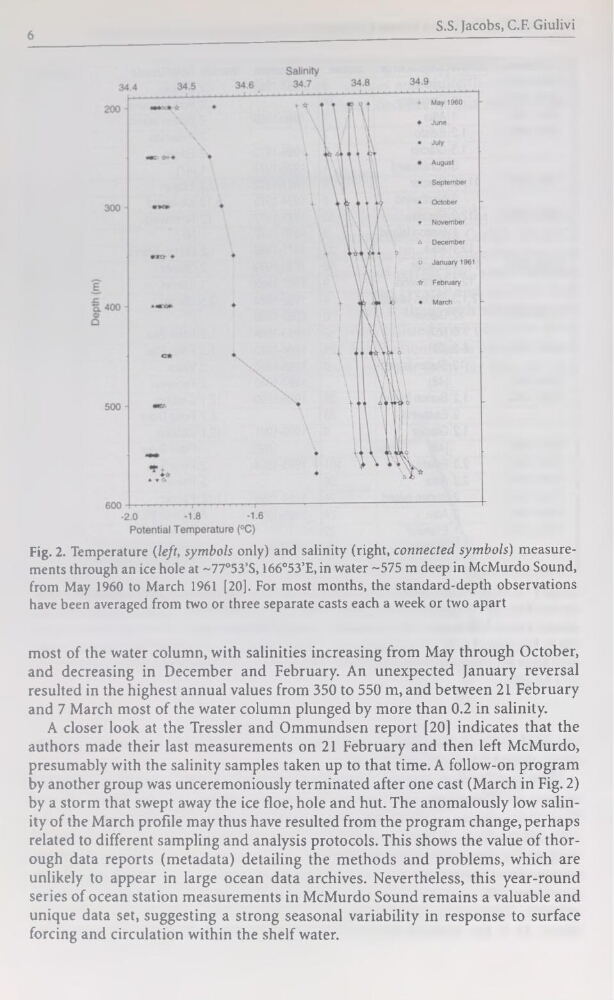
Fig. 2. Température {left, symbols only) and salinity (right, connected symbols) measurements through an ice hole at ~77°53’S, 166°53’E, in water -575 m deep in McMurdo Sound,
from May 1960 to March 1961 [20]. For most months, the standard-depth observations
hâve been averaged from two or three separate casts each a week or two apart
most of the water column, with salinities increasing from May through October,
and decreasing in December and February. An unexpected January reversai
resulted in the highest annual values from 350 to 550 m, and between 21 February
and 7 March most of the water column plunged by more than 0.2 in salinity.
A doser look at the Tressler and Ommundsen report [20] indicates that the
authors made their last measurements on 21 February and then left McMurdo,
presumably with the salinity samples taken up to that time. A follow-on program
by another group was unceremoniously terminated after one cast (March in Fig. 2)
by a storm that swept away the ice floe, hole and hut. The anomalously low salinity of the March profile may thus hâve resulted from the program change, perhaps
related to different sampling and analysis protocols. This shows the value of thorough data reports (metadata) detailing the methods and problems, which are
unlikely to appear in large océan data archives. Nevertheless, this year-round
sériés of océan station measurements in McMurdo Sound remains a valuable and
unique data set, suggesting a strong seasonal variability in response to surface
forcing and circulation within the shelf water.
6
Fig. 2. Température {left, symbols only) and salinity (right, connected symbols) measurements through an ice hole at ~77°53’S, 166°53’E, in water -575 m deep in McMurdo Sound,
from May 1960 to March 1961 [20]. For most months, the standard-depth observations
hâve been averaged from two or three separate casts each a week or two apart
most of the water column, with salinities increasing from May through October,
and decreasing in December and February. An unexpected January reversai
resulted in the highest annual values from 350 to 550 m, and between 21 February
and 7 March most of the water column plunged by more than 0.2 in salinity.
A doser look at the Tressler and Ommundsen report [20] indicates that the
authors made their last measurements on 21 February and then left McMurdo,
presumably with the salinity samples taken up to that time. A follow-on program
by another group was unceremoniously terminated after one cast (March in Fig. 2)
by a storm that swept away the ice floe, hole and hut. The anomalously low salinity of the March profile may thus hâve resulted from the program change, perhaps
related to different sampling and analysis protocols. This shows the value of thorough data reports (metadata) detailing the methods and problems, which are
unlikely to appear in large océan data archives. Nevertheless, this year-round
sériés of océan station measurements in McMurdo Sound remains a valuable and
unique data set, suggesting a strong seasonal variability in response to surface
forcing and circulation within the shelf water.