

A Wind and Boundary Driven Circulation Model of the Ross Sea
137
10
20
30
40
50
60
70
80
90
100
110
120
130
140
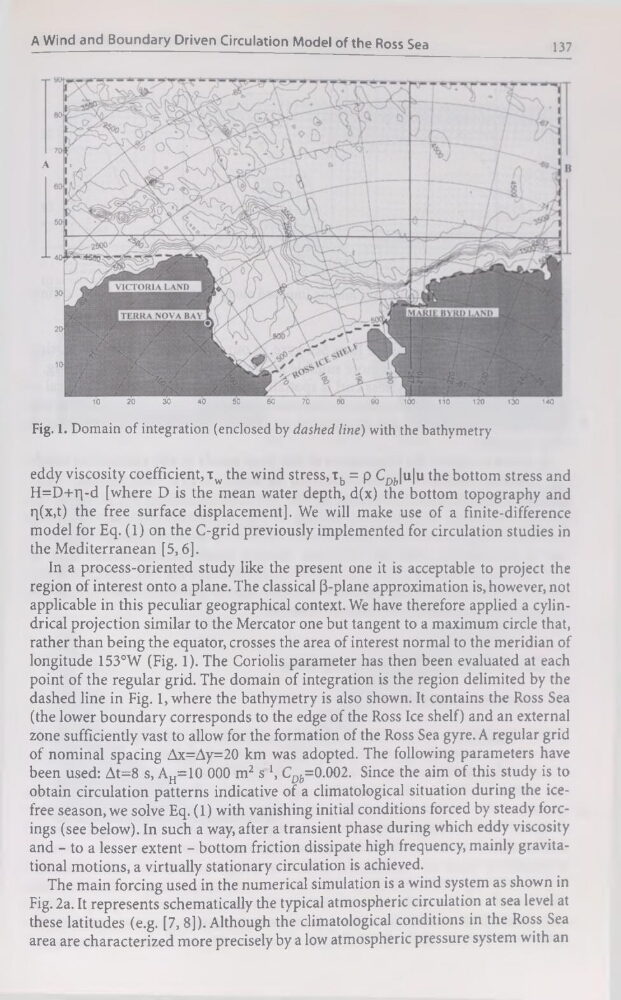
Fig. 1. Domain of intégration (enclosed by dashed line) with the bathymetry
eddy viscosity coefficient, Tw the wind stress, Tb = p CDfc|u|u the bottom stress and
H=D+q-d [where D is the mean water depth, d(x) the bottom topography and
q(x,t) the free surface displacement]. We will make use of a finite-difference
model for Eq. (1) on the C-grid previously implemented for circulation studies in
the Mediterranean [5,6].
In a process-oriented study like the présent one it is acceptable to project the
région of interest onto a plane. The classical [3-plane approximation is, however, not
applicable in this peculiar geographical context. We hâve therefore applied a cylindrical projection similar to the Mercator one but tangent to a maximum circle that,
rather than being the equator, crosses the area of interest normal to the meridian of
longitude 153°W (Fig. 1). The Coriolis parameter has then been evaluated at each
point of the regular grid. The domain of intégration is the région delimited by the
dashed line in Fig. 1, where the bathymetry is also shown. It contains the Ross Sea
(the lower boundary corresponds to the edge of the Ross Ice shelf) and an external
zone sufficiently vast to allow for the formation of the Ross Sea gyre. A regular grid
of nominal spacing Ax=Ay=20 km was adopted. The following parameters hâve
been used: At=8 s, AH=10 000 m2 s1, CDfc=0.002. Since the aim of this study is to
obtain circulation patterns indicative of a climatological situation during the icefree season, we solve Eq. (1) with vanishing initial conditions forced by steady forcings (see below). In such a way, after a transient phase during which eddy viscosity
and - to a lesser extent - bottom friction dissipate high frequency, mainly gravitational motions, a virtually stationary circulation is achieved.
The main forcing used in the numerical simulation is a wind System as shown in
Fig. 2a. It represents schematically the typical atmospheric circulation at sea level at
these latitudes (e.g. [7, 8]). Although the climatological conditions in the Ross Sea
area are characterized more precisely by a low atmospheric pressure System with an
137
10
20
30
40
50
60
70
80
90
100
110
120
130
140
Fig. 1. Domain of intégration (enclosed by dashed line) with the bathymetry
eddy viscosity coefficient, Tw the wind stress, Tb = p CDfc|u|u the bottom stress and
H=D+q-d [where D is the mean water depth, d(x) the bottom topography and
q(x,t) the free surface displacement]. We will make use of a finite-difference
model for Eq. (1) on the C-grid previously implemented for circulation studies in
the Mediterranean [5,6].
In a process-oriented study like the présent one it is acceptable to project the
région of interest onto a plane. The classical [3-plane approximation is, however, not
applicable in this peculiar geographical context. We hâve therefore applied a cylindrical projection similar to the Mercator one but tangent to a maximum circle that,
rather than being the equator, crosses the area of interest normal to the meridian of
longitude 153°W (Fig. 1). The Coriolis parameter has then been evaluated at each
point of the regular grid. The domain of intégration is the région delimited by the
dashed line in Fig. 1, where the bathymetry is also shown. It contains the Ross Sea
(the lower boundary corresponds to the edge of the Ross Ice shelf) and an external
zone sufficiently vast to allow for the formation of the Ross Sea gyre. A regular grid
of nominal spacing Ax=Ay=20 km was adopted. The following parameters hâve
been used: At=8 s, AH=10 000 m2 s1, CDfc=0.002. Since the aim of this study is to
obtain circulation patterns indicative of a climatological situation during the icefree season, we solve Eq. (1) with vanishing initial conditions forced by steady forcings (see below). In such a way, after a transient phase during which eddy viscosity
and - to a lesser extent - bottom friction dissipate high frequency, mainly gravitational motions, a virtually stationary circulation is achieved.
The main forcing used in the numerical simulation is a wind System as shown in
Fig. 2a. It represents schematically the typical atmospheric circulation at sea level at
these latitudes (e.g. [7, 8]). Although the climatological conditions in the Ross Sea
area are characterized more precisely by a low atmospheric pressure System with an