

The Large-Scale Thermohaline Structure of the Ross Gyre
97
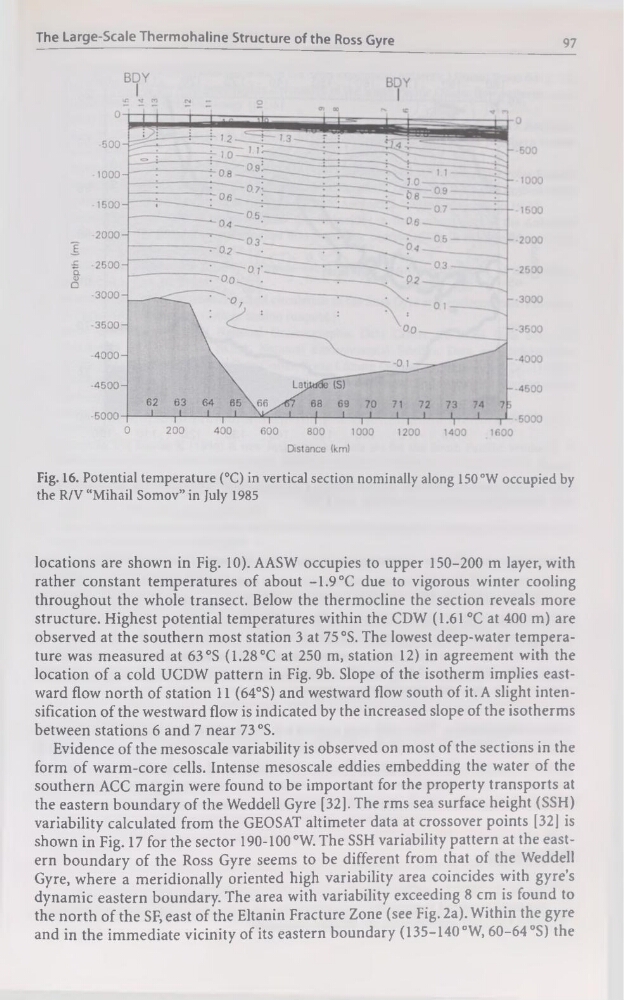
Fig. 16. Potential température (°C) in vertical section nominally along 150°W occupied by
the R/V “Mihail Somov” in July 1985
locations are shown in Fig. 10). AASW occupies to upper 150-200 m layer, with
rather constant températures of about -1.9 °C due to vigorous winter cooling
throughout the whole transect. Below the thermocline the section reveals more
structure. Highest potential températures within the CDW (1.61 °C at 400 m) are
observed at the Southern most station 3 at 75 °S. The lowest deep-water température was measured at 63 °S (1.28°C at 250 m, station 12) in agreement with the
location of a cold UCDW pattern in Fig. 9b. Slope of the isotherm implies eastward flow north of station 11 (64°S) and westward flow south of it. A slight intensification of the westward flow is indicated by the increased slope of the isotherms
between stations 6 and 7 near 73 °S.
Evidence of the mesoscale variability is observed on most of the sections in the
form of warm-core cells. Intense mesoscale eddies embedding the water of the
Southern ACC margin were found to be important for the property transports at
the eastern boundary of the Weddell Gyre [32]. The rms sea surface height (SSH)
variability calculated from the GEOSAT altimeter data at crossover points [32] is
shown in Fig. 17 for the sector 190-100 °W. The SSH variability pattern at the eastern boundary of the Ross Gyre seems to be different from that of the Weddell
Gyre, where a meridionally oriented high variability area coincides with gyre's
dynamic eastern boundary. The area with variability exceeding 8 cm is found to
the north of the SF, east of the Eltanin Fracture Zone (see Fig. 2a). Within the gyre
and in the immédiate vicinity of its eastern boundary (135-140 °W, 60-64 °S) the
97
Fig. 16. Potential température (°C) in vertical section nominally along 150°W occupied by
the R/V “Mihail Somov” in July 1985
locations are shown in Fig. 10). AASW occupies to upper 150-200 m layer, with
rather constant températures of about -1.9 °C due to vigorous winter cooling
throughout the whole transect. Below the thermocline the section reveals more
structure. Highest potential températures within the CDW (1.61 °C at 400 m) are
observed at the Southern most station 3 at 75 °S. The lowest deep-water température was measured at 63 °S (1.28°C at 250 m, station 12) in agreement with the
location of a cold UCDW pattern in Fig. 9b. Slope of the isotherm implies eastward flow north of station 11 (64°S) and westward flow south of it. A slight intensification of the westward flow is indicated by the increased slope of the isotherms
between stations 6 and 7 near 73 °S.
Evidence of the mesoscale variability is observed on most of the sections in the
form of warm-core cells. Intense mesoscale eddies embedding the water of the
Southern ACC margin were found to be important for the property transports at
the eastern boundary of the Weddell Gyre [32]. The rms sea surface height (SSH)
variability calculated from the GEOSAT altimeter data at crossover points [32] is
shown in Fig. 17 for the sector 190-100 °W. The SSH variability pattern at the eastern boundary of the Ross Gyre seems to be different from that of the Weddell
Gyre, where a meridionally oriented high variability area coincides with gyre's
dynamic eastern boundary. The area with variability exceeding 8 cm is found to
the north of the SF, east of the Eltanin Fracture Zone (see Fig. 2a). Within the gyre
and in the immédiate vicinity of its eastern boundary (135-140 °W, 60-64 °S) the