

94 Computational Modelling in Hydraulic and Coastal Engineering
Example 5.2
This exercise describes the routing of a flood wave over a constant
width rectangular channel with an initial dry bed, y(x, t = 0) = 0. The
data used for the simulation are the following:
Channel width = 100 m
Channel length = 41,000 m
Bed slope = 0.001
Chezy’s coefficient of friction = 50 m 1/2 /s
The data for the inflow hydrograph (upstream boundary condition) are
shown in Table 5.1. The downstream boundary condition was defined
by a flow over weir relationship. The spatial and temporal discretization
steps were selected as Δx = 1000 m and Δt = 5 s. Since the inflow hydrograph discretization step (δt = 2000 s) is different from that of the computational time step (Δt = 5 s) an interpolation procedure is performed.
The simulation was conducted for a period of 45,000 seconds
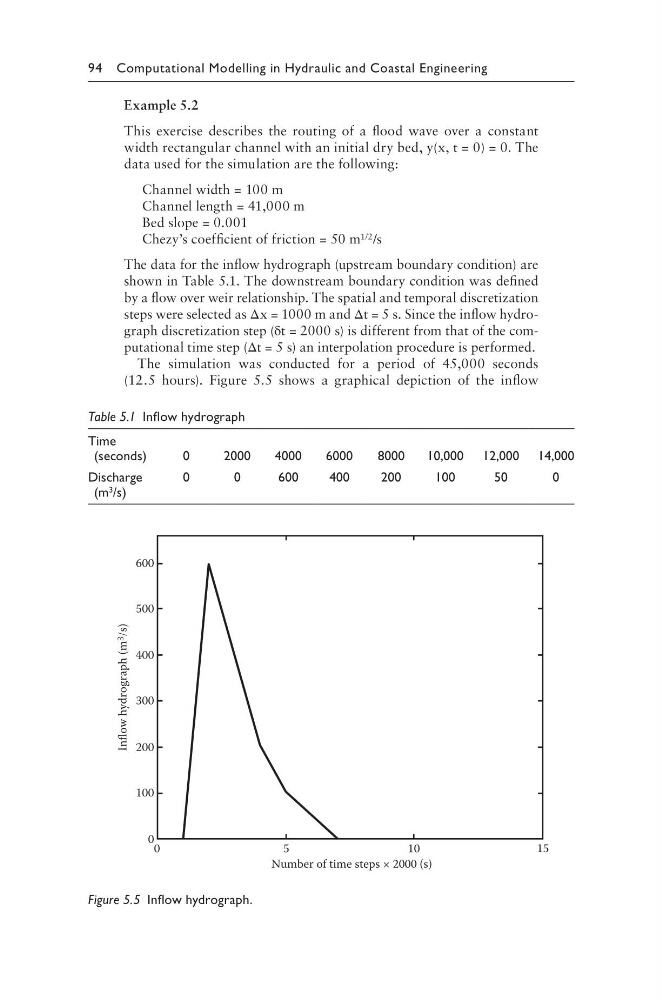
(12.5 hours). Figure 5.5 shows a graphical depiction of the inflow
Table 5.1 Inflow hydrograph
Time
(seconds)
0
2000
4000
6000
8000
10,000 12,000 14,000
Discharge
(m 3 /s)
0
0
600
400
200
100
50
0
600
500
400
300
200
100
0
0
5
10
15
Number of time steps × 2000 (s)
Inflow hydrograph (m 3
/s)
Figure 5.5 Inflow hydrograph.
Example 5.2
This exercise describes the routing of a flood wave over a constant
width rectangular channel with an initial dry bed, y(x, t = 0) = 0. The
data used for the simulation are the following:
Channel width = 100 m
Channel length = 41,000 m
Bed slope = 0.001
Chezy’s coefficient of friction = 50 m 1/2 /s
The data for the inflow hydrograph (upstream boundary condition) are
shown in Table 5.1. The downstream boundary condition was defined
by a flow over weir relationship. The spatial and temporal discretization
steps were selected as Δx = 1000 m and Δt = 5 s. Since the inflow hydrograph discretization step (δt = 2000 s) is different from that of the computational time step (Δt = 5 s) an interpolation procedure is performed.
The simulation was conducted for a period of 45,000 seconds
(12.5 hours). Figure 5.5 shows a graphical depiction of the inflow
Table 5.1 Inflow hydrograph
Time
(seconds)
0
2000
4000
6000
8000
10,000 12,000 14,000
Discharge
(m 3 /s)
0
0
600
400
200
100
50
0
600
500
400
300
200
100
0
0
5
10
15
Number of time steps × 2000 (s)
Inflow hydrograph (m 3
/s)
Figure 5.5 Inflow hydrograph.