

Free surface flows 95
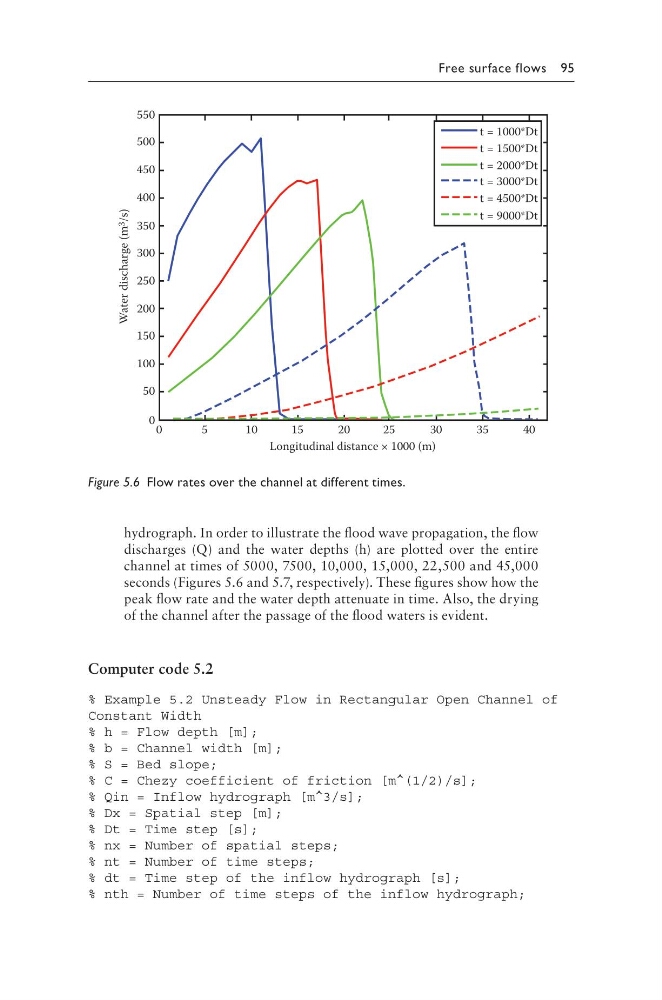
hydrograph. In order to illustrate the flood wave propagation, the flow
discharges (Q) and the water depths (h) are plotted over the entire
channel at times of 5000, 7500, 10,000, 15,000, 22,500 and 45,000
seconds (Figures 5.6 and 5.7, respectively). These figures show how the
peak flow rate and the water depth attenuate in time. Also, the drying
of the channel after the passage of the flood waters is evident.
Computer code 5.2
% Example 5.2 Unsteady Flow in Rectangular Open Channel of
Constant Width
% h = Flow depth [m];
% b = Channel width [m];
% S = Bed slope;
% C = Chezy coefficient of friction [m^(1/2)/s];
% Qin = Inflow hydrograph [m^3/s];
% Dx = Spatial step [m];
% Dt = Time step [s];
% nx = Number of spatial steps;
% nt = Number of time steps;
% dt = Time step of the inflow hydrograph [s];
% nth = Number of time steps of the inflow hydrograph;
550
500
450
400
350
300
250
200
150
100
50
0 0
5
10
15
20
25
30
35
40
Longitudinal distance × 1000 (m)
Water discharge (m 3
/s)
t = 1000*Dt
t = 1500*Dt
t = 2000*Dt
t = 3000*Dt
t = 4500*Dt
t = 9000*Dt
Figure 5.6 Flow rates over the channel at different times.
hydrograph. In order to illustrate the flood wave propagation, the flow
discharges (Q) and the water depths (h) are plotted over the entire
channel at times of 5000, 7500, 10,000, 15,000, 22,500 and 45,000
seconds (Figures 5.6 and 5.7, respectively). These figures show how the
peak flow rate and the water depth attenuate in time. Also, the drying
of the channel after the passage of the flood waters is evident.
Computer code 5.2
% Example 5.2 Unsteady Flow in Rectangular Open Channel of
Constant Width
% h = Flow depth [m];
% b = Channel width [m];
% S = Bed slope;
% C = Chezy coefficient of friction [m^(1/2)/s];
% Qin = Inflow hydrograph [m^3/s];
% Dx = Spatial step [m];
% Dt = Time step [s];
% nx = Number of spatial steps;
% nt = Number of time steps;
% dt = Time step of the inflow hydrograph [s];
% nth = Number of time steps of the inflow hydrograph;
550
500
450
400
350
300
250
200
150
100
50
0 0
5
10
15
20
25
30
35
40
Longitudinal distance × 1000 (m)
Water discharge (m 3
/s)
t = 1000*Dt
t = 1500*Dt
t = 2000*Dt
t = 3000*Dt
t = 4500*Dt
t = 9000*Dt
Figure 5.6 Flow rates over the channel at different times.