

150
STATISTICAL DESCRIPTIONS OF OFFSHORE WAVES
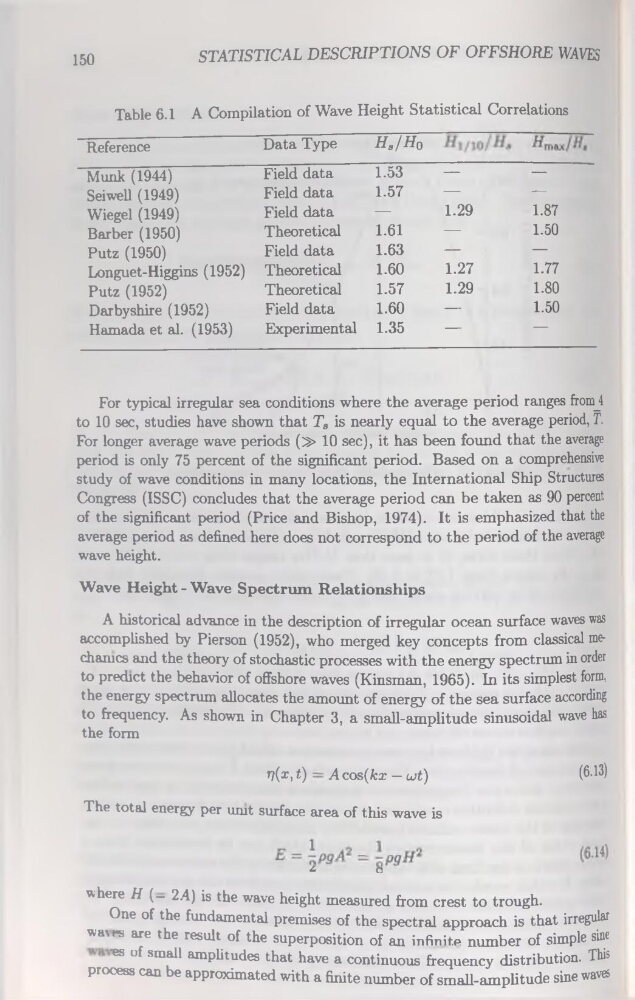
Table 6.1 A Compilation of Wave Height Statistical Corrélations
Référencé
Data Type
Hs/H0
Munk (1944)
Field data
1.53
—
—
Seiwell (1949)
Field data
1.57
—
“—
Wiegel (1949)
Field data
—
1.29
1.87
Barber (1950)
Theoretical
1.61
—
1.50
Putz (1950)
Field data
1.63
—
—
Longuet-Higgins (1952) Theoretical
1.60
1.27
1.77
Putz (1952)
Theoretical
1.57
1.29
1.80
Darbyshire (1952)
Field data
1.60
—
1.50
Hamada et al. (1953)
Experimental 1.35
—
—
For typical irregular sea conditions where the average period ranges fromj
to 10 sec, studies hâve shown that Ta is nearly equal to the average period, T.
For longer average wave periods (2> 10 sec), it has been found that the average
period is only 75 percent of the significant period. Based on a comprehensive
study of wave conditions in many locations, the International Ship Structures
Congress (ISSC) concludes that the average period can be taken as 90 percent
of the significant period (Price and Bishop, 1974). It is emphasized that the
average period as defined here does not correspond to the period of the average
wave height.
Wave Height - Wave Spectrum Relationships
A historical advance in the description of irregular océan surface waves was
accomplished by Pierson (1952), who merged key concepts from classical méchantes and the theory of stochastic processes with the energy spectrum in order
to predict the behavior of offshore waves (Kinsman, 1965). In its simplest form,
the energy spectrum allocates the amount of energy of the sea surface according
to frequency. As shown in Chapter 3, a small-amplitude sinusoïdal wave has
the form
r?(æ, t) A cos(kæ — ut)
(6-^)
The total energy per unit surface area of this wave is
4
O
where H (— 2 A) is the wave height measured from crest to trough.
One of the fundamental promises of the spectral approach is that irregular
wa\cs are the resuit of the superposition of an infinité number of simple sine
■es of small amplitudes that hâve a continuons frequency distribution. This
process can be approximated with a finite number of small-amplitude sine waves
STATISTICAL DESCRIPTIONS OF OFFSHORE WAVES
Table 6.1 A Compilation of Wave Height Statistical Corrélations
Référencé
Data Type
Hs/H0
Munk (1944)
Field data
1.53
—
—
Seiwell (1949)
Field data
1.57
—
“—
Wiegel (1949)
Field data
—
1.29
1.87
Barber (1950)
Theoretical
1.61
—
1.50
Putz (1950)
Field data
1.63
—
—
Longuet-Higgins (1952) Theoretical
1.60
1.27
1.77
Putz (1952)
Theoretical
1.57
1.29
1.80
Darbyshire (1952)
Field data
1.60
—
1.50
Hamada et al. (1953)
Experimental 1.35
—
—
For typical irregular sea conditions where the average period ranges fromj
to 10 sec, studies hâve shown that Ta is nearly equal to the average period, T.
For longer average wave periods (2> 10 sec), it has been found that the average
period is only 75 percent of the significant period. Based on a comprehensive
study of wave conditions in many locations, the International Ship Structures
Congress (ISSC) concludes that the average period can be taken as 90 percent
of the significant period (Price and Bishop, 1974). It is emphasized that the
average period as defined here does not correspond to the period of the average
wave height.
Wave Height - Wave Spectrum Relationships
A historical advance in the description of irregular océan surface waves was
accomplished by Pierson (1952), who merged key concepts from classical méchantes and the theory of stochastic processes with the energy spectrum in order
to predict the behavior of offshore waves (Kinsman, 1965). In its simplest form,
the energy spectrum allocates the amount of energy of the sea surface according
to frequency. As shown in Chapter 3, a small-amplitude sinusoïdal wave has
the form
r?(æ, t) A cos(kæ — ut)
(6-^)
The total energy per unit surface area of this wave is
4
O
where H (— 2 A) is the wave height measured from crest to trough.
One of the fundamental promises of the spectral approach is that irregular
wa\cs are the resuit of the superposition of an infinité number of simple sine
■es of small amplitudes that hâve a continuons frequency distribution. This
process can be approximated with a finite number of small-amplitude sine waves