

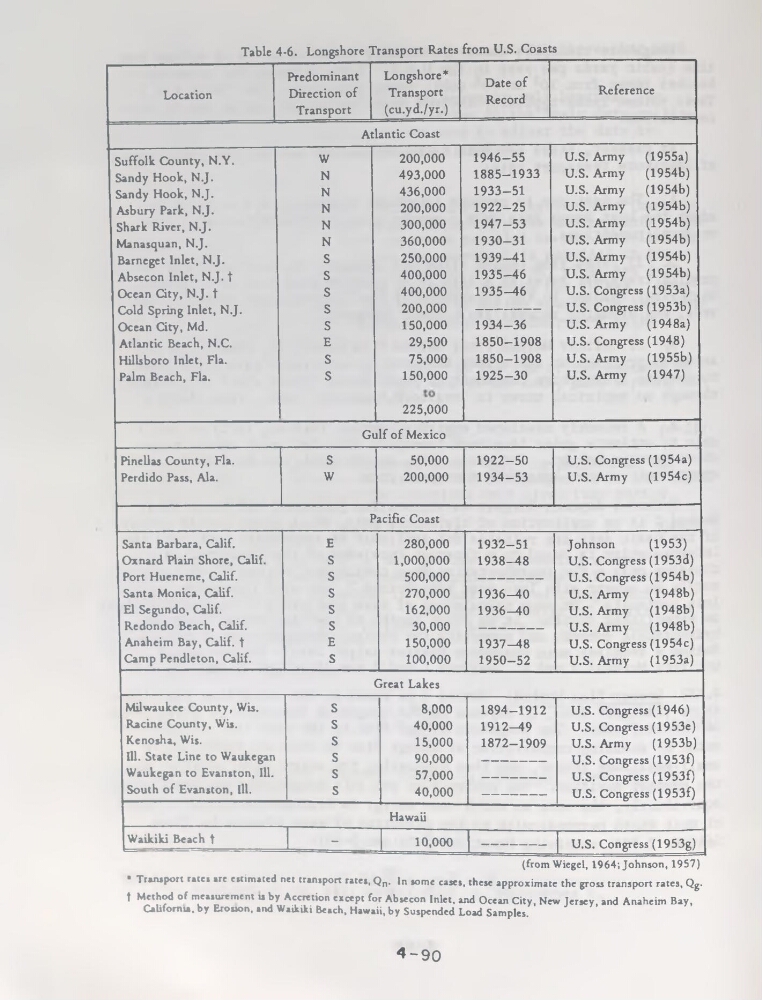
Table 4-6. Longshore Transport Rates from U.S. Coasts
Location
Prédominant
Direction of
Transport
Longshore*
Transport
(cu.yd./yr.)
Date of
Record
Reference
Atlantic Coast
Suffolk County, N.Y.
W
200,000
1946-55
U.S. Army
(1955a)
Sandy Hook, NJ.
N
493,000
1885-1933
U.S. Army
(1954b)
Sandy Hook, N.J.
N
436,000
1933-51
U.S. Army
(1954b)
Asbury Park, N.J.
N
200,000
1922-25
U.S. Army
(1954b)
Shark River, N.J.
N
300,000
1947-53
U.S. Army
(1954b)
Manasquan, N.J.
N
360,000
1930-31
U.S. Army
(1954b)
Barneget Inlet, N.J.
S
250,000
1939—41
U.S. Army
(1954b)
Absecon Inlet, N.J. t
S
400,000
1935-46
U.S. Army
(1954b)
Océan City, N.J. t
S
400,000
1935-46
U.S. Congress (1953a)
Cold Spring Inlet, N.J.
s
200,000
—
U.S. Congress (1953b)
Océan City, Md.
s
150,000
1934-36
U.S. Army
(1948a)
Atlantic Beach, N.C.
E
29,500
1850-1908
U.S. Congress (1948)
Hillsboro Inlet, Fia.
S
75,000
1850-1908
U.S. Army
(1955b)
Palm Beach, Fia.
S
150,000
1925-30
U.S. Army
(1947)
225,000
Gulf of Mexico
Pinellas County, Fia.
S
50,000
1922-50
U.S. Congress (1954a)
Perdido Pass, Ala.
W
200,000
1934-53
U.S. Army
(1954c)
Pacific Coast
Santa Barbara, Calif.
E
280,000
1932-51
Johnson
(1953)
Oxnard Plain Shore, Calif.
S
1,000,000
1938-48
U.S. Congress (1953d)
Port Hueneme, Calif.
S
500,000
—
U.S. Congress (1954b)
Santa Monica, Calif.
S
270,000
1936-40
U.S. Army
(1948b)
El Segundo, Calif.
S
162,000
1936-40
U.S. Army
(1948b)
Redondo Beach, Calif.
S
30,000
—
U.S. Army
(1948b)
Anaheim Bay, Calif. t
E
150,000
1937-48
U.S. Congress (1954c)
Camp Pendleton, Calif.
S
100,000
1950-52
U.S. Army
(1953a)
Great Lakes
Milwaukee County, Wis.
S
8,000
1894-1912
U.S. Congress (1946)
Racine County, Wis.
S
40,000
1912-49
U.S. Congress (1953e)
Kenosha, Wis.
S
15,000
1872-1909
U.S. Army
(1953b)
111. State Line to Waukegan
S
90,000
—
U.S. Congress (1953f)
Waukegan to Evanston, 111.
S
57,000
—
U.S. Congress (1953f)
South of Evanston, 111.
S
40,000
—
U.S. Congress (1953f)
Hawaii
Waikiki Beach t
-
10,000
—
U.S. Congress (1953g)
(fromWiegel, 1964; Johnson, 1957)
• Transport rates are estimated net transport rates, Qn. In some cases, these approximate the gross transport rates, Qg.
f Method of measurcment u by Accretion except for Absecon Inlet, and Océan City, New Jersey, and Anaheim Bay,
California, by Erosion, and Waikiki Beach, Hawaii, by Suspended Load Samples.
4-90
Location
Prédominant
Direction of
Transport
Longshore*
Transport
(cu.yd./yr.)
Date of
Record
Reference
Atlantic Coast
Suffolk County, N.Y.
W
200,000
1946-55
U.S. Army
(1955a)
Sandy Hook, NJ.
N
493,000
1885-1933
U.S. Army
(1954b)
Sandy Hook, N.J.
N
436,000
1933-51
U.S. Army
(1954b)
Asbury Park, N.J.
N
200,000
1922-25
U.S. Army
(1954b)
Shark River, N.J.
N
300,000
1947-53
U.S. Army
(1954b)
Manasquan, N.J.
N
360,000
1930-31
U.S. Army
(1954b)
Barneget Inlet, N.J.
S
250,000
1939—41
U.S. Army
(1954b)
Absecon Inlet, N.J. t
S
400,000
1935-46
U.S. Army
(1954b)
Océan City, N.J. t
S
400,000
1935-46
U.S. Congress (1953a)
Cold Spring Inlet, N.J.
s
200,000
—
U.S. Congress (1953b)
Océan City, Md.
s
150,000
1934-36
U.S. Army
(1948a)
Atlantic Beach, N.C.
E
29,500
1850-1908
U.S. Congress (1948)
Hillsboro Inlet, Fia.
S
75,000
1850-1908
U.S. Army
(1955b)
Palm Beach, Fia.
S
150,000
1925-30
U.S. Army
(1947)
225,000
Gulf of Mexico
Pinellas County, Fia.
S
50,000
1922-50
U.S. Congress (1954a)
Perdido Pass, Ala.
W
200,000
1934-53
U.S. Army
(1954c)
Pacific Coast
Santa Barbara, Calif.
E
280,000
1932-51
Johnson
(1953)
Oxnard Plain Shore, Calif.
S
1,000,000
1938-48
U.S. Congress (1953d)
Port Hueneme, Calif.
S
500,000
—
U.S. Congress (1954b)
Santa Monica, Calif.
S
270,000
1936-40
U.S. Army
(1948b)
El Segundo, Calif.
S
162,000
1936-40
U.S. Army
(1948b)
Redondo Beach, Calif.
S
30,000
—
U.S. Army
(1948b)
Anaheim Bay, Calif. t
E
150,000
1937-48
U.S. Congress (1954c)
Camp Pendleton, Calif.
S
100,000
1950-52
U.S. Army
(1953a)
Great Lakes
Milwaukee County, Wis.
S
8,000
1894-1912
U.S. Congress (1946)
Racine County, Wis.
S
40,000
1912-49
U.S. Congress (1953e)
Kenosha, Wis.
S
15,000
1872-1909
U.S. Army
(1953b)
111. State Line to Waukegan
S
90,000
—
U.S. Congress (1953f)
Waukegan to Evanston, 111.
S
57,000
—
U.S. Congress (1953f)
South of Evanston, 111.
S
40,000
—
U.S. Congress (1953f)
Hawaii
Waikiki Beach t
-
10,000
—
U.S. Congress (1953g)
(fromWiegel, 1964; Johnson, 1957)
• Transport rates are estimated net transport rates, Qn. In some cases, these approximate the gross transport rates, Qg.
f Method of measurcment u by Accretion except for Absecon Inlet, and Océan City, New Jersey, and Anaheim Bay,
California, by Erosion, and Waikiki Beach, Hawaii, by Suspended Load Samples.
4-90