

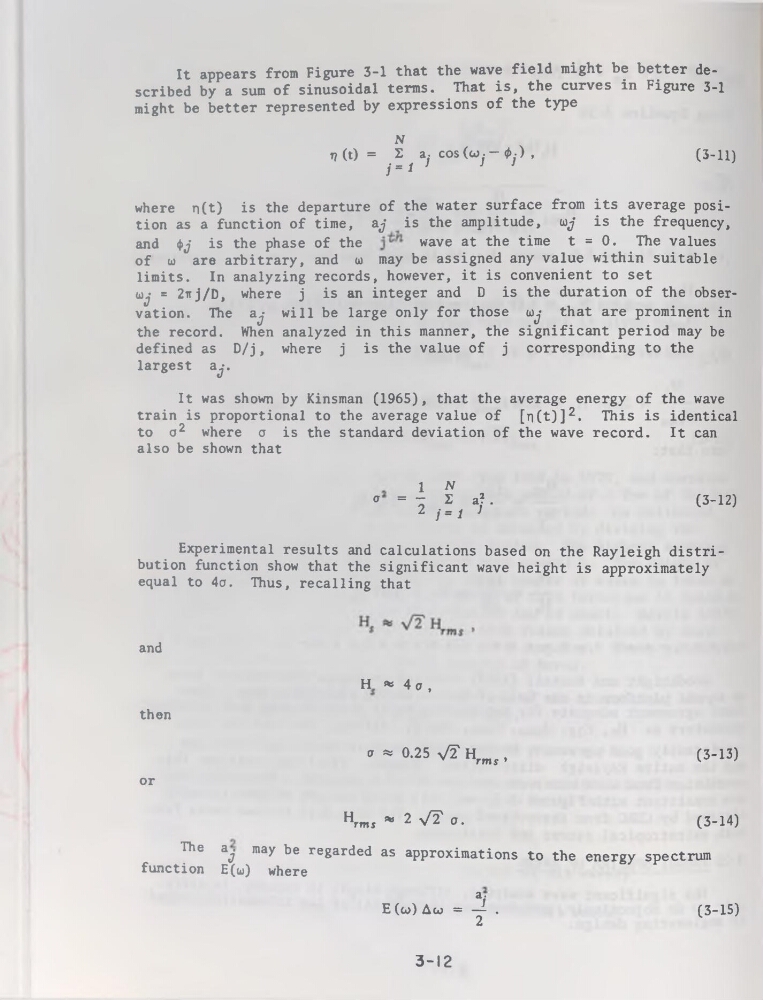
It appears from Figure 3-1 that the wave field might be better described by a sum of sinusoidal terms. That is, the curves in Figure 3-1
might be better represented by expressions of the type
N
ri (t) = 2 a, cos (w - - |.) ,
y-l ’
’
’
(3-11)
where n(t) is the departure of the water surface from its average position as a function of time, aj is the amplitude, œj is the frequency,
and |j is the phase of the
wave at the time t = 0. The values
of u) are arbitrary, and œ may be assigned any value within suitable
limits. In analyzing records, however, it is convenient to set
wj = 2nj/D, where j is an integer and D is the duration of the observation. The a.j will be large only for those œj that are prominent in
the record. When analyzed in this manner, the significant period may be
defined as D/j, where j is the value of j corresponding to the
largest aj.
It was shown by Kinsman (1965), that the average energy of the wave
train is proportional to the average value of (n(t)]2. This is identical
to o2 where a is the standard déviation of the wave record. It can
also be shown that
2
1 N
0 = ô S a? .
(3-12)
2 j = 1 J
Experimental results and calculations based on the Rayleigh distribution function show that the significant wave height is approximately
equal to 4a. Thus, recalling that
and
H * 4 a ,
then
a * 0.25 VT H
,
(3-13)
rms 1
v
or
Hrmj * 2 VT o.
(3-14)
The a^. may be regarded as approximations to the energy spectrum
function E(w) where
ay
E (w) Aw = — .
(3-15)
3-12
might be better represented by expressions of the type
N
ri (t) = 2 a, cos (w - - |.) ,
y-l ’
’
’
(3-11)
where n(t) is the departure of the water surface from its average position as a function of time, aj is the amplitude, œj is the frequency,
and |j is the phase of the
wave at the time t = 0. The values
of u) are arbitrary, and œ may be assigned any value within suitable
limits. In analyzing records, however, it is convenient to set
wj = 2nj/D, where j is an integer and D is the duration of the observation. The a.j will be large only for those œj that are prominent in
the record. When analyzed in this manner, the significant period may be
defined as D/j, where j is the value of j corresponding to the
largest aj.
It was shown by Kinsman (1965), that the average energy of the wave
train is proportional to the average value of (n(t)]2. This is identical
to o2 where a is the standard déviation of the wave record. It can
also be shown that
2
1 N
0 = ô S a? .
(3-12)
2 j = 1 J
Experimental results and calculations based on the Rayleigh distribution function show that the significant wave height is approximately
equal to 4a. Thus, recalling that
and
H * 4 a ,
then
a * 0.25 VT H
,
(3-13)
rms 1
v
or
Hrmj * 2 VT o.
(3-14)
The a^. may be regarded as approximations to the energy spectrum
function E(w) where
ay
E (w) Aw = — .
(3-15)
3-12