

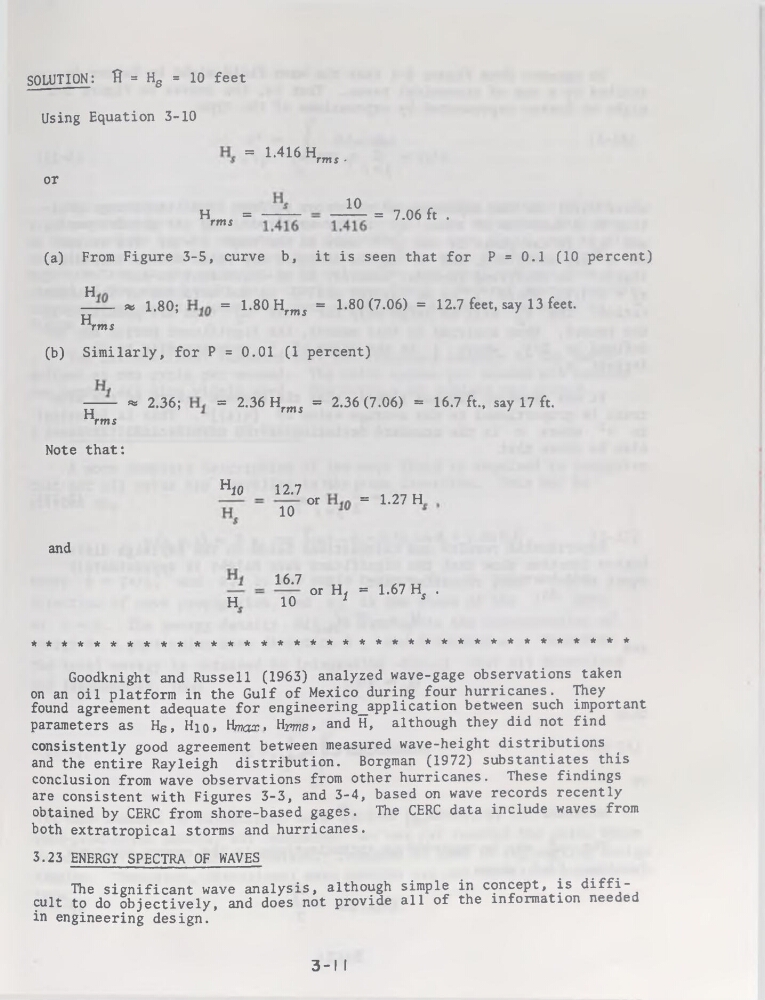
1-416 H, rms •
10
— = 7.06 ft .
SOLUTION : fî = Hfî = 10 feet
Using Equation 3-10
=
or
H
=
rms
(a) From Figure 3-5, curve b, it is seen that for P = 0.1 (10 percent)
PJ
—— « 1.80;
= 1.80 Hrm5 = 1.80(7.06) = 12.7 feet, say 13 feet.
Hfms
(b) Similarly, for P = 0.01 (1 percent)
------- « 2.36;
= 2.36 Hrms = 2.36 (7.06) = 16.7 ft., say 17 ft.
Hftns
Note that:
and
H10
12.7
10
or
= 1.27 H,
16.7
10
or H, = 1.67 H, .
H
*************************************
Goodknight and Russell (1963) analyzed wave-gage observations taken
on an oil platform in the Gulf of Mexico during four hurricanes. They
found agreement adéquate for engineering_application between such important
parameters as Hg, Hjq, Hm<7.T< Hp^g, and H, although they did not find
consistently good agreement between measured wave-height distributions
and the entire Rayleigh distribution. Borgman (1972) substantiates this
conclusion from wave observations from other hurricanes. These findings
are consistent with Figures 3-3, and 3-4, based on wave records recently
obtained by CERC from shore-based gages. The CERC data include waves from
both extratropical storms and hurricanes.
3.23 ENERGY SPECTRA OF WAVES
The significant wave analysis, although simple in concept, is difficult to do objectively, and does not provide ail of the information needed
in engineering design.
3-1 I
10
— = 7.06 ft .
SOLUTION : fî = Hfî = 10 feet
Using Equation 3-10
=
or
H
=
rms
(a) From Figure 3-5, curve b, it is seen that for P = 0.1 (10 percent)
PJ
—— « 1.80;
= 1.80 Hrm5 = 1.80(7.06) = 12.7 feet, say 13 feet.
Hfms
(b) Similarly, for P = 0.01 (1 percent)
------- « 2.36;
= 2.36 Hrms = 2.36 (7.06) = 16.7 ft., say 17 ft.
Hftns
Note that:
and
H10
12.7
10
or
= 1.27 H,
16.7
10
or H, = 1.67 H, .
H
*************************************
Goodknight and Russell (1963) analyzed wave-gage observations taken
on an oil platform in the Gulf of Mexico during four hurricanes. They
found agreement adéquate for engineering_application between such important
parameters as Hg, Hjq, Hm<7.T< Hp^g, and H, although they did not find
consistently good agreement between measured wave-height distributions
and the entire Rayleigh distribution. Borgman (1972) substantiates this
conclusion from wave observations from other hurricanes. These findings
are consistent with Figures 3-3, and 3-4, based on wave records recently
obtained by CERC from shore-based gages. The CERC data include waves from
both extratropical storms and hurricanes.
3.23 ENERGY SPECTRA OF WAVES
The significant wave analysis, although simple in concept, is difficult to do objectively, and does not provide ail of the information needed
in engineering design.
3-1 I