

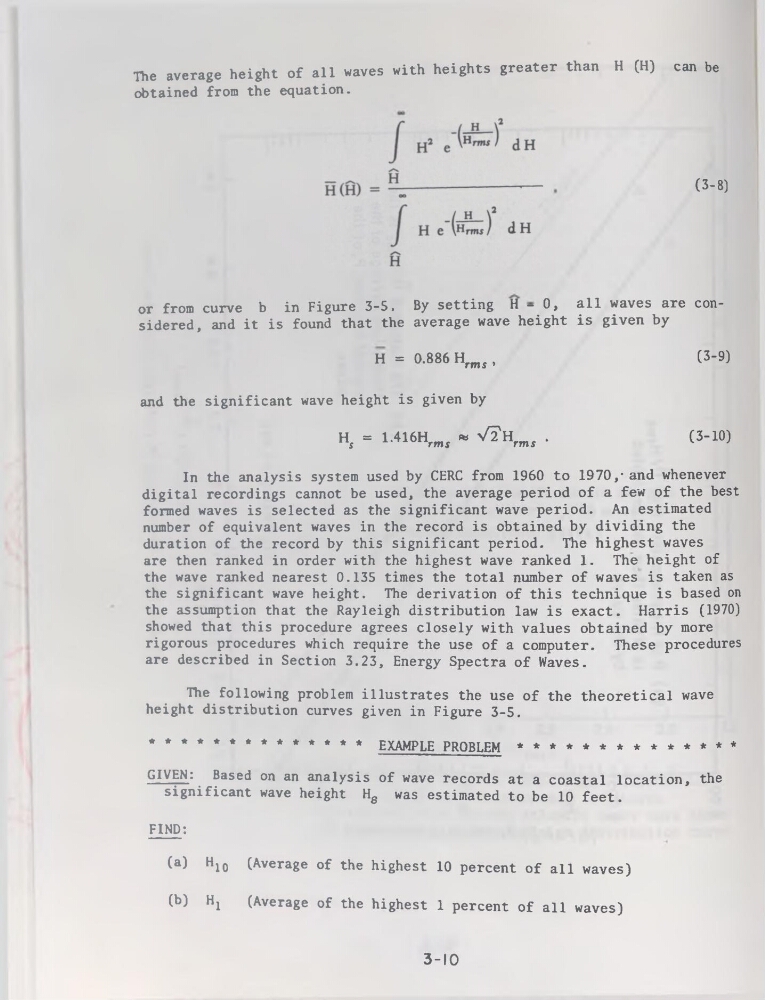
The average height of ail waves with heights greater than H (H) can be
obtained from the équation.
(3-8)
or from curve b in Figure 3-5. By setting H - 0, ail waves are considérée!, and it is found that the average wave height is given by
H = 0.886 Hrms ,
and the significant wave height is given by
Hs = l-416Hrmi « 'ÆHrmî .
(3-9)
(3-10)
In the analysis System used by CERC from 1960 to 1970,’and whenever
digital recordings cannot be used, the average period of a few of the best
formed waves is selected as the significant wave period. An estimated
number of équivalent waves in the record is obtained by dividing the
duration of the record by this significant period. The highest waves
are then ranked in order with the highest wave ranked 1. The height of
the wave ranked nearest 0.135 times the total number of waves is taken as
the significant wave height. The dérivation of this technique is based on
the assumption that the Rayleigh distribution law is exact. Harris (1970)
showed that this procedure agréés closely with values obtained by more
rigorous procedures which require the use of a computer. These procedures
are described in Section 3.23, Energy Spectra of Waves.
The following problem illustrâtes the use of the theoretical wave
height distribution curves given in Figure 3-5.
************** EXAMPLE PROBLEM **************
GIVEN: Based on an analysis of wave records at a Coastal location, the
significant wave height Hg was estimated to be 10 feet.
FIND:
(a) H10 (Average of the highest 10 percent of ail waves)
(b) Hj
(Average of the highest 1 percent of ail waves)
3-10
obtained from the équation.
(3-8)
or from curve b in Figure 3-5. By setting H - 0, ail waves are considérée!, and it is found that the average wave height is given by
H = 0.886 Hrms ,
and the significant wave height is given by
Hs = l-416Hrmi « 'ÆHrmî .
(3-9)
(3-10)
In the analysis System used by CERC from 1960 to 1970,’and whenever
digital recordings cannot be used, the average period of a few of the best
formed waves is selected as the significant wave period. An estimated
number of équivalent waves in the record is obtained by dividing the
duration of the record by this significant period. The highest waves
are then ranked in order with the highest wave ranked 1. The height of
the wave ranked nearest 0.135 times the total number of waves is taken as
the significant wave height. The dérivation of this technique is based on
the assumption that the Rayleigh distribution law is exact. Harris (1970)
showed that this procedure agréés closely with values obtained by more
rigorous procedures which require the use of a computer. These procedures
are described in Section 3.23, Energy Spectra of Waves.
The following problem illustrâtes the use of the theoretical wave
height distribution curves given in Figure 3-5.
************** EXAMPLE PROBLEM **************
GIVEN: Based on an analysis of wave records at a Coastal location, the
significant wave height Hg was estimated to be 10 feet.
FIND:
(a) H10 (Average of the highest 10 percent of ail waves)
(b) Hj
(Average of the highest 1 percent of ail waves)
3-10