

486
Chemical Oceanography, 4th Edition
the bottom samples) was lost to the headspace in the sample bottles. We thus give the calculated values of TCO 2 (Figure 10.77) for the samples below the interface. The values of TCO 2
were calculated based on the pH and TA. The TCO 2 increased rapidly below the interface
because of the oxidation of organic matter to inorganic carbon. The concentration of TCO 2
in the bottom water was 17.3 mM, which was 1 mM lower than earlier values (Skei, 1988).
Salinity increased sharply from the surface to the interface, while the temperature
showed an inflection at 14 m (σ t = 14.19) and reached a submaximum at 16.6 m (σ t = 14.87).
The same temperature structure was observed in previous studies. However, the extent
of the increase of temperature has varied (Figure 10.77). It was most significant in 1984
(ΔT = 4.7°C). The depth of the temperature inflection varied from 9 to 14 m (σ T = 13.2
to 16.0). This “submaximum temperature layer” might originate from the warm surface
water of the Helvikfjord as discussed. The extent of the temperature anomaly and the
depth of the submaximum temperature layer depend on the extent of the water exchange
Transmission (%)
0
20
40
60
Depth (m)
0
10
20
30
40
50
60
70
80
90
100
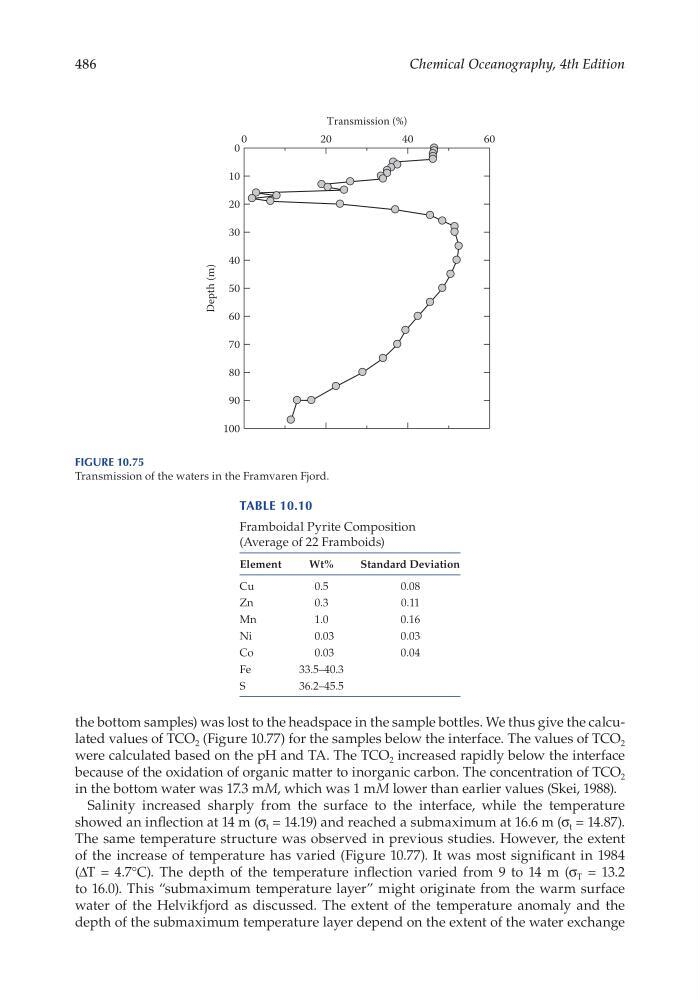
Figure 10.75
Transmission of the waters in the Framvaren Fjord.
Table 10.10
Framboidal Pyrite Composition
(Average of 22 Framboids)
Element
Wt%
Standard Deviation
Cu
0.5
0.08
Zn
0.3
0.11
Mn
1.0
0.16
Ni
0.03
0.03
Co
0.03
0.04
Fe
33.5–40.3
S
36.2–45.5
Chemical Oceanography, 4th Edition
the bottom samples) was lost to the headspace in the sample bottles. We thus give the calculated values of TCO 2 (Figure 10.77) for the samples below the interface. The values of TCO 2
were calculated based on the pH and TA. The TCO 2 increased rapidly below the interface
because of the oxidation of organic matter to inorganic carbon. The concentration of TCO 2
in the bottom water was 17.3 mM, which was 1 mM lower than earlier values (Skei, 1988).
Salinity increased sharply from the surface to the interface, while the temperature
showed an inflection at 14 m (σ t = 14.19) and reached a submaximum at 16.6 m (σ t = 14.87).
The same temperature structure was observed in previous studies. However, the extent
of the increase of temperature has varied (Figure 10.77). It was most significant in 1984
(ΔT = 4.7°C). The depth of the temperature inflection varied from 9 to 14 m (σ T = 13.2
to 16.0). This “submaximum temperature layer” might originate from the warm surface
water of the Helvikfjord as discussed. The extent of the temperature anomaly and the
depth of the submaximum temperature layer depend on the extent of the water exchange
Transmission (%)
0
20
40
60
Depth (m)
0
10
20
30
40
50
60
70
80
90
100
Figure 10.75
Transmission of the waters in the Framvaren Fjord.
Table 10.10
Framboidal Pyrite Composition
(Average of 22 Framboids)
Element
Wt%
Standard Deviation
Cu
0.5
0.08
Zn
0.3
0.11
Mn
1.0
0.16
Ni
0.03
0.03
Co
0.03
0.04
Fe
33.5–40.3
S
36.2–45.5