

487
Processes in the Oceans
and the difference in the hydrographic properties of the two basins. This water intrusion
caused the nonlinear relationship between temperature and salinity across the interface.
This suggests that horizontal transport might be an important process near the interface,
which has to be considered in explaining the vertical profiles of chemical species.
In the deep water, the salinity increased slightly from the interface down to 80 m, while
temperature decreased sharply down to 60 m and was almost constant between 60 and
80 m. Both temperature and salinity increased from 80 to 100 m. There was no linear
T- S relationship in the deep water (Figure 10.79). The nature of the curvature in the bottom water suggested an additional source of heat flow. As discussed, chemical species
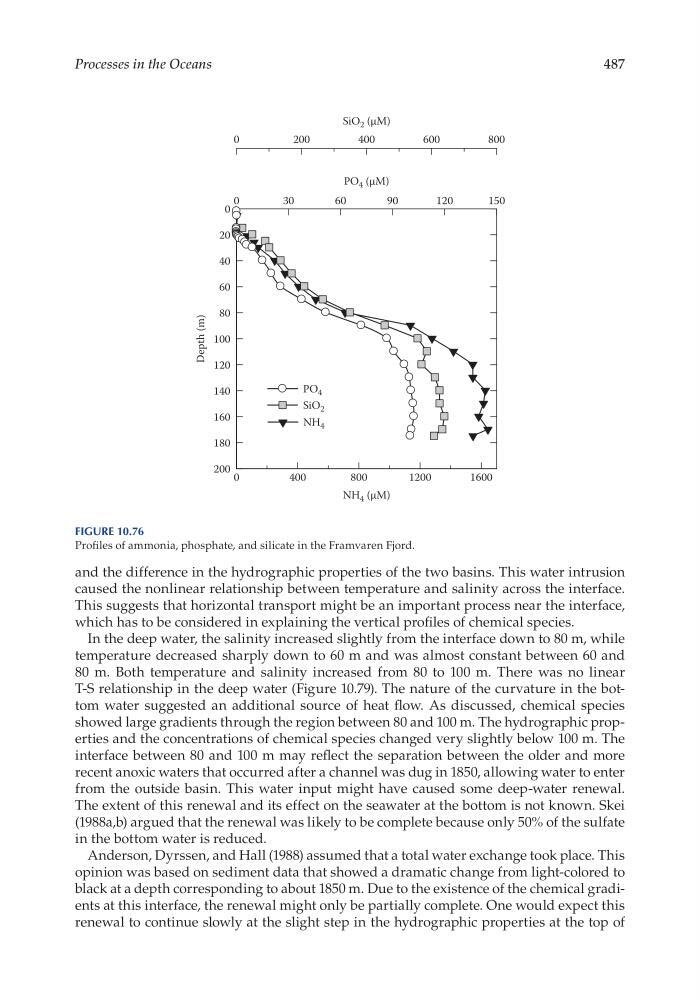
showed large gradients through the region between 80 and 100 m. The hydrographic properties and the concentrations of chemical species changed very slightly below 100 m. The
interface between 80 and 100 m may reflect the separation between the older and more
recent anoxic waters that occurred after a channel was dug in 1850, allowing water to enter
from the outside basin. This water input might have caused some deep- water renewal.
The extent of this renewal and its effect on the seawater at the bottom is not known. Skei
(1988a,b) argued that the renewal was likely to be complete because only 50% of the sulfate
in the bottom water is reduced.
Anderson, Dyrssen, and Hall (1988) assumed that a total water exchange took place. This
opinion was based on sediment data that showed a dramatic change from light- colored to
black at a depth corresponding to about 1850 m. Due to the existence of the chemical gradients at this interface, the renewal might only be partially complete. One would expect this
renewal to continue slowly at the slight step in the hydrographic properties at the top of
0
400
800
1200
1600
NH 4
NH 4 (µM)
0
200
400
600
800
PO 4
SiO 2 (µM)
0
30
60
90
120
150
0
20
40
60
80
100
120
140
160
180
200
SiO 2
PO 4 (µM)
Depth (m)
Figure 10.76
Profiles of ammonia, phosphate, and silicate in the Framvaren Fjord.
Processes in the Oceans
and the difference in the hydrographic properties of the two basins. This water intrusion
caused the nonlinear relationship between temperature and salinity across the interface.
This suggests that horizontal transport might be an important process near the interface,
which has to be considered in explaining the vertical profiles of chemical species.
In the deep water, the salinity increased slightly from the interface down to 80 m, while
temperature decreased sharply down to 60 m and was almost constant between 60 and
80 m. Both temperature and salinity increased from 80 to 100 m. There was no linear
T- S relationship in the deep water (Figure 10.79). The nature of the curvature in the bottom water suggested an additional source of heat flow. As discussed, chemical species
showed large gradients through the region between 80 and 100 m. The hydrographic properties and the concentrations of chemical species changed very slightly below 100 m. The
interface between 80 and 100 m may reflect the separation between the older and more
recent anoxic waters that occurred after a channel was dug in 1850, allowing water to enter
from the outside basin. This water input might have caused some deep- water renewal.
The extent of this renewal and its effect on the seawater at the bottom is not known. Skei
(1988a,b) argued that the renewal was likely to be complete because only 50% of the sulfate
in the bottom water is reduced.
Anderson, Dyrssen, and Hall (1988) assumed that a total water exchange took place. This
opinion was based on sediment data that showed a dramatic change from light- colored to
black at a depth corresponding to about 1850 m. Due to the existence of the chemical gradients at this interface, the renewal might only be partially complete. One would expect this
renewal to continue slowly at the slight step in the hydrographic properties at the top of
0
400
800
1200
1600
NH 4
NH 4 (µM)
0
200
400
600
800
PO 4
SiO 2 (µM)
0
30
60
90
120
150
0
20
40
60
80
100
120
140
160
180
200
SiO 2
PO 4 (µM)
Depth (m)
Figure 10.76
Profiles of ammonia, phosphate, and silicate in the Framvaren Fjord.