

485
Processes in the Oceans
The concentration of phosphate in the surface water was about 0.4 μM and reached a
minimum (0.18 mM) between 16 and 18 m, which may have been due to the high productivity at this region or absorption onto Mn and Fe particles. Maximum values of particulate Mn and Fe are usually found at or above the O 2 –H 2 S interface. The PO 4
3– increased
rapidly below the interface and reached a maximum of 100 to 102 μM in the bottom
water (Figure 10.76). Ammonia was present in the oxic euphotic zone at about 5.0 μM. It
increased rapidly below the interface and reached a maximum of 1.6 μM in the bottom
waters (Figure 10.76). Relatively high (~20 μM) silicate was found in the oxic waters, and
the concentrations increased rapidly below the interface to a maximum of 640 μM in the
bottom water (Figure 10.76). The concentrations of phosphate, ammonium, and silicate in
the bottom water were all close to the results of earlier studies (Skei, 1988a,b).
The distributions of pH, TA, and TCO 2 are plotted in Figure 10.77. The pH in the surface
waters was about 7.89 and decreased to a minimum (6.98) at 15 m. The low pH at 15 m is
difficult to explain, although it agrees with the calculated value using TA and TCO 2 . The
pH decreased below the interface and was constant (about 6.90) below 90 m.
The TA increased with depth from the surface to the interface, corresponding with the
increase in salinity. The average normalized (to S = 35) TA (NTA) was 2.41 mM in the surface water, which is slightly higher than the value in ocean surface water (about 2.35),
probably because of the impact of freshwater with high NTA. Below the interface, the TA
increased rapidly because of the bacterial anaerobic respiration of organic matter to bicarbonate and simultaneous reduction of sulfate to hydrogen sulfide. The TA was 19.8 μM in
the bottom water, which was about 1 mM lower than earlier results (Skei, 1988).
The TCO 2 in the water samples was determined after poisoned samples were returned to
the laboratory. Due to the extremely high TCO 2 in the anoxic waters (the pCO 2 in the bottom water was as high as 38,000 μatm), a large amount of CO 2 in samples (about 2 mM in
ATP (µg L
–1 )
0.0
0.5
1.0
1.5
2.0
2.5
3.0
Depth (m)
0
20
40
60
80
100
120
140
160
180
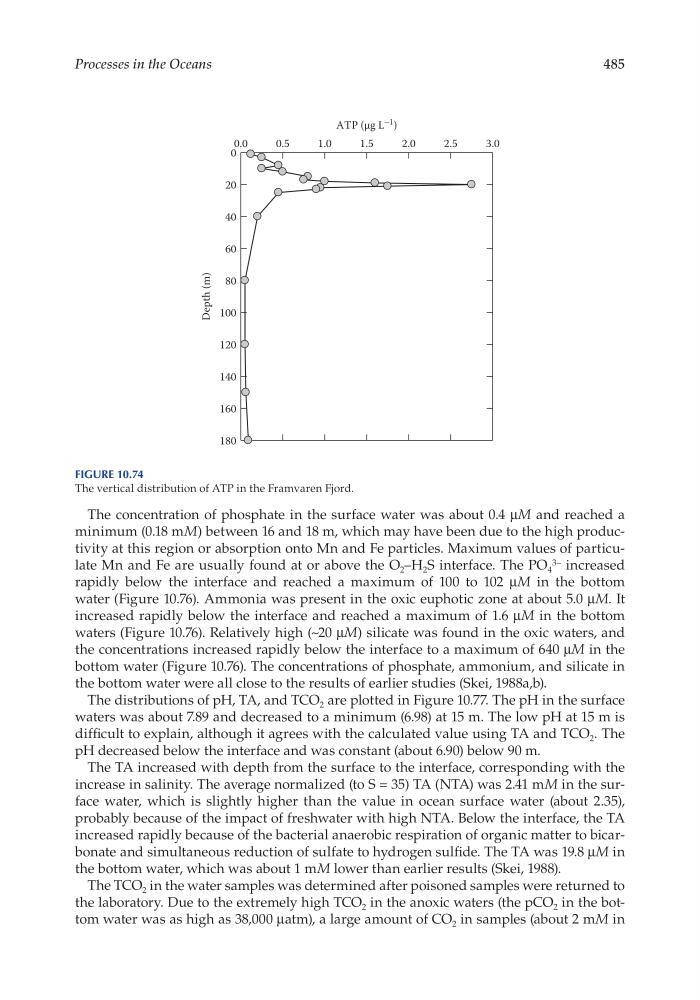
Figure 10.74
The vertical distribution of ATP in the Framvaren Fjord.
Processes in the Oceans
The concentration of phosphate in the surface water was about 0.4 μM and reached a
minimum (0.18 mM) between 16 and 18 m, which may have been due to the high productivity at this region or absorption onto Mn and Fe particles. Maximum values of particulate Mn and Fe are usually found at or above the O 2 –H 2 S interface. The PO 4
3– increased
rapidly below the interface and reached a maximum of 100 to 102 μM in the bottom
water (Figure 10.76). Ammonia was present in the oxic euphotic zone at about 5.0 μM. It
increased rapidly below the interface and reached a maximum of 1.6 μM in the bottom
waters (Figure 10.76). Relatively high (~20 μM) silicate was found in the oxic waters, and
the concentrations increased rapidly below the interface to a maximum of 640 μM in the
bottom water (Figure 10.76). The concentrations of phosphate, ammonium, and silicate in
the bottom water were all close to the results of earlier studies (Skei, 1988a,b).
The distributions of pH, TA, and TCO 2 are plotted in Figure 10.77. The pH in the surface
waters was about 7.89 and decreased to a minimum (6.98) at 15 m. The low pH at 15 m is
difficult to explain, although it agrees with the calculated value using TA and TCO 2 . The
pH decreased below the interface and was constant (about 6.90) below 90 m.
The TA increased with depth from the surface to the interface, corresponding with the
increase in salinity. The average normalized (to S = 35) TA (NTA) was 2.41 mM in the surface water, which is slightly higher than the value in ocean surface water (about 2.35),
probably because of the impact of freshwater with high NTA. Below the interface, the TA
increased rapidly because of the bacterial anaerobic respiration of organic matter to bicarbonate and simultaneous reduction of sulfate to hydrogen sulfide. The TA was 19.8 μM in
the bottom water, which was about 1 mM lower than earlier results (Skei, 1988).
The TCO 2 in the water samples was determined after poisoned samples were returned to
the laboratory. Due to the extremely high TCO 2 in the anoxic waters (the pCO 2 in the bottom water was as high as 38,000 μatm), a large amount of CO 2 in samples (about 2 mM in
ATP (µg L
–1 )
0.0
0.5
1.0
1.5
2.0
2.5
3.0
Depth (m)
0
20
40
60
80
100
120
140
160
180
Figure 10.74
The vertical distribution of ATP in the Framvaren Fjord.