

432
Chemical Oceanography, 4th Edition
2.
Org* + O 2 → Org + + O 2
–
(10.25)
Org* + sub → Org – + sub +
(10.26)
Org* + sub → Org + + sub –
(10.27)
Org + + sub → Org + sub +
(10.28)
Org – + O 2 → Org + O 2
–
(10.29)
sub – + O 2 → sub + O 2
–
(10.30)
3.
M n+ + hν → M (n–1) + L –
(10.31)
M (n–1) + O 2 → Mν+ + O 2
–
(10.32)
Studies by Zika and coworkers (1982) indicate that the formation of H 2 O 2 is higher
in coastal waters with higher humic concentrations than in oligotrophic waters (see
Figure 10.9). The production rates also appear to be directly related to the concentration of
the humic material in the waters (see Figure 10.10) as measured by absorbance at 300 nm.
These results support the notion that abiotic photochemical processes are responsible for
the production of hydrogen peroxide in the surface waters of the oceans. The biological
(Palenik and Morel, 1988) and nonphotochemical processes known to form hydrogen peroxide are generally insignificant, except in oligotrophic waters. The portion of the sunlight
responsible for most of the formation of H 2 O 2 is below 400 nm.
Since steady- state levels of H 2 O 2 of 10 to 200 nM are found in surface waters, the decay
rates of H 2 O 2 must be slower than the production rates. The diurnal variation of H 2 O 2 is
from 60 to 180 nM (see Figure 10.11). The half- times of H 2 O 2 in Gulf Stream waters are
2200
1800
1400
λ (nm)
1000
Downward Irradiance (W · m
–2
· nm
–1
)
600
10 m
100 m
1 m
1 cm
Surface
220
5
10
15
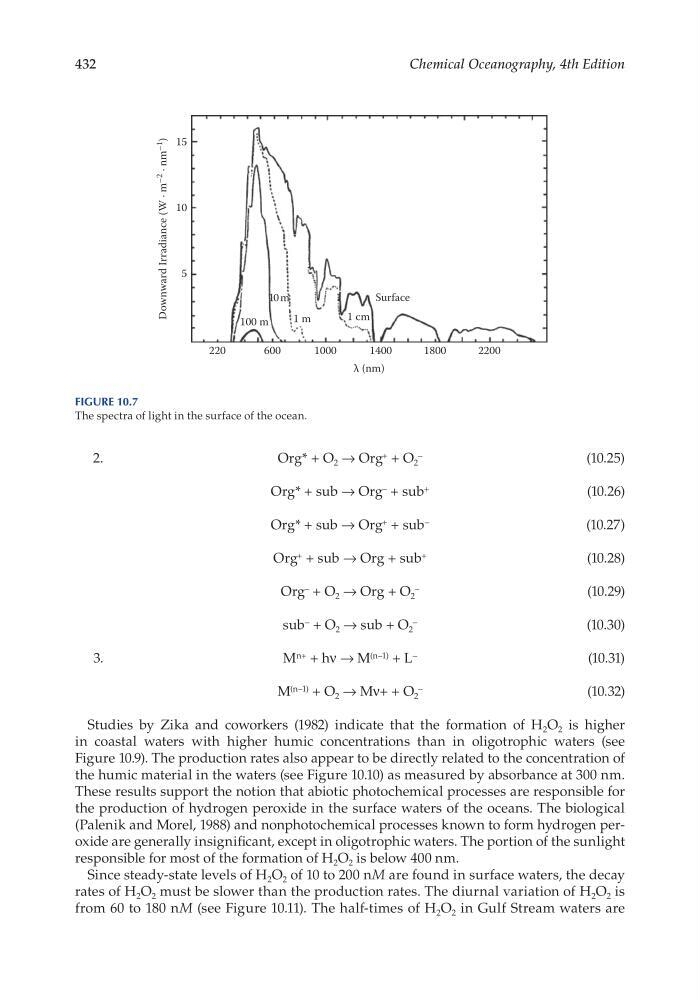
Figure 10.7
The spectra of light in the surface of the ocean.
Chemical Oceanography, 4th Edition
2.
Org* + O 2 → Org + + O 2
–
(10.25)
Org* + sub → Org – + sub +
(10.26)
Org* + sub → Org + + sub –
(10.27)
Org + + sub → Org + sub +
(10.28)
Org – + O 2 → Org + O 2
–
(10.29)
sub – + O 2 → sub + O 2
–
(10.30)
3.
M n+ + hν → M (n–1) + L –
(10.31)
M (n–1) + O 2 → Mν+ + O 2
–
(10.32)
Studies by Zika and coworkers (1982) indicate that the formation of H 2 O 2 is higher
in coastal waters with higher humic concentrations than in oligotrophic waters (see
Figure 10.9). The production rates also appear to be directly related to the concentration of
the humic material in the waters (see Figure 10.10) as measured by absorbance at 300 nm.
These results support the notion that abiotic photochemical processes are responsible for
the production of hydrogen peroxide in the surface waters of the oceans. The biological
(Palenik and Morel, 1988) and nonphotochemical processes known to form hydrogen peroxide are generally insignificant, except in oligotrophic waters. The portion of the sunlight
responsible for most of the formation of H 2 O 2 is below 400 nm.
Since steady- state levels of H 2 O 2 of 10 to 200 nM are found in surface waters, the decay
rates of H 2 O 2 must be slower than the production rates. The diurnal variation of H 2 O 2 is
from 60 to 180 nM (see Figure 10.11). The half- times of H 2 O 2 in Gulf Stream waters are
2200
1800
1400
λ (nm)
1000
Downward Irradiance (W · m
–2
· nm
–1
)
600
10 m
100 m
1 m
1 cm
Surface
220
5
10
15
Figure 10.7
The spectra of light in the surface of the ocean.