

403
Primary Production in the Oceans
in the Pacific (Coale et al., 1996; Martin et al., 1991) and the Southern Oceans (Bakker et al.,
2001; Boyd et al., 2000; Bozec et al., 2004; Coale et al., 2004) is shown in Table 9.7.
9.3 Microbial Transformations
Microorganisms in the marine environment can be divided into two types: (a) eukaryotes
(10 to 100 μm), which have a complete cell structure and include algae (photosynthetic),
protozoa (predators of bacteria) and fungi, yeast, and molds (nonphotosynthetic); and
(b) prokaryotes (1 to 10 μm), which eat single cells and include bacteria (0.5 to 10 μm),
Table 9.7
Slopes of Linear Regressions and Standard Error of Slope for
Nutrients Observed during IRONEX II, EisenEx, and SOFeX
Compared to Redfield Proportions
Ratio
IronEx II a
EisenEx b
North Patch
South Patch
Redfield c
ΔC:ΔP
90 ± 5
82 ± 5
104 ± 18
98.4 ± 2.3
106
ΔC:ΔN
6.2 ± 0.2
5.9 ± 0.2
8.8 ± 0.9
6.7 ± 0.2
6.6
ΔC:ΔSi
5.1 ± 0.3
2.9 ± 0.3
8.2 ± 0.9
5.7 ± 0.2
7.3
ΔC:ΔO 2
–0.72 ± 0.07
—
–0.73 ± 0.02
–0.74 ± 0.04
–0.77
ΔN:ΔP
14.3 ± 0.2
12 ± 0.2
13.8 ± 0.15
13.9 ± 0.08
16
ΔSi:ΔN
1.2 ± 0.1
2.0 ± 0.4
1.04 ± 0.02
1.11 ± 0.01
0.9
a Data from Steinberg, Millero, and Zhu (1998).
b Data from Bozec et al. (2004).
c Data from Redfield, Ketchum, and Richards (1963).
420
410
400
390
380
370
360
350
01/27
01/31
02/04
02/08
02/12
02/16
pCO
2 (µatm)
South Patch pCO 2
pCO 2 (µatm)
404 (µatm)
∆ - 15 (µatm)
∆ - 23 (µatm)
∆ - 30 (µatm)
∆ - 34 (µatm)
∆ - 45 (µatm)
Date (UTC)
Atmospheric (µatm)
Draw Down
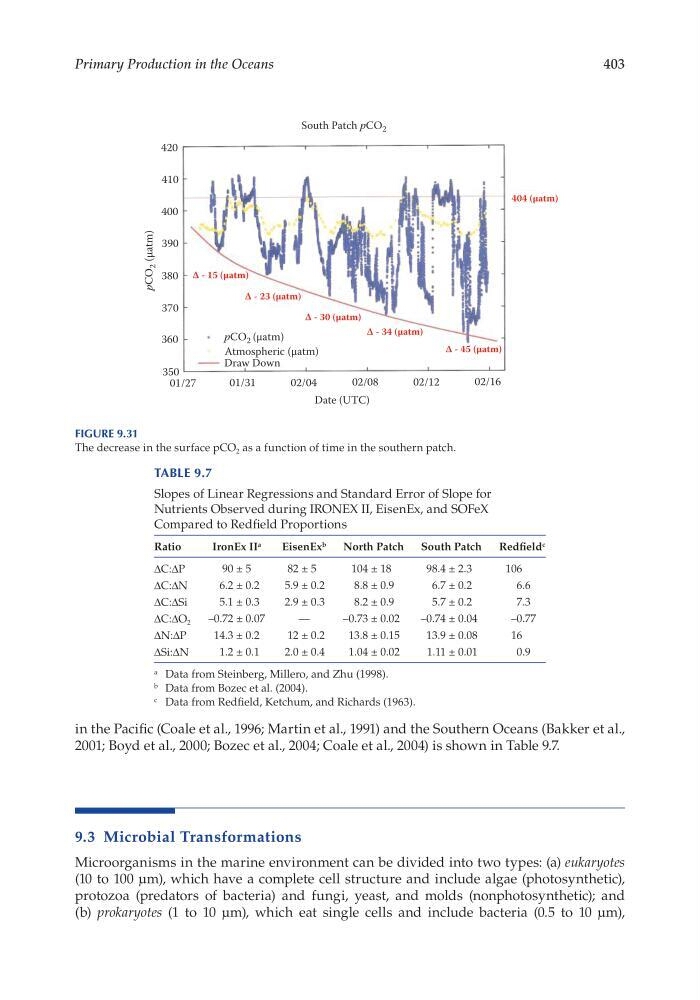
Figure 9.31
The decrease in the surface pCO 2 as a function of time in the southern patch.
Primary Production in the Oceans
in the Pacific (Coale et al., 1996; Martin et al., 1991) and the Southern Oceans (Bakker et al.,
2001; Boyd et al., 2000; Bozec et al., 2004; Coale et al., 2004) is shown in Table 9.7.
9.3 Microbial Transformations
Microorganisms in the marine environment can be divided into two types: (a) eukaryotes
(10 to 100 μm), which have a complete cell structure and include algae (photosynthetic),
protozoa (predators of bacteria) and fungi, yeast, and molds (nonphotosynthetic); and
(b) prokaryotes (1 to 10 μm), which eat single cells and include bacteria (0.5 to 10 μm),
Table 9.7
Slopes of Linear Regressions and Standard Error of Slope for
Nutrients Observed during IRONEX II, EisenEx, and SOFeX
Compared to Redfield Proportions
Ratio
IronEx II a
EisenEx b
North Patch
South Patch
Redfield c
ΔC:ΔP
90 ± 5
82 ± 5
104 ± 18
98.4 ± 2.3
106
ΔC:ΔN
6.2 ± 0.2
5.9 ± 0.2
8.8 ± 0.9
6.7 ± 0.2
6.6
ΔC:ΔSi
5.1 ± 0.3
2.9 ± 0.3
8.2 ± 0.9
5.7 ± 0.2
7.3
ΔC:ΔO 2
–0.72 ± 0.07
—
–0.73 ± 0.02
–0.74 ± 0.04
–0.77
ΔN:ΔP
14.3 ± 0.2
12 ± 0.2
13.8 ± 0.15
13.9 ± 0.08
16
ΔSi:ΔN
1.2 ± 0.1
2.0 ± 0.4
1.04 ± 0.02
1.11 ± 0.01
0.9
a Data from Steinberg, Millero, and Zhu (1998).
b Data from Bozec et al. (2004).
c Data from Redfield, Ketchum, and Richards (1963).
420
410
400
390
380
370
360
350
01/27
01/31
02/04
02/08
02/12
02/16
pCO
2 (µatm)
South Patch pCO 2
pCO 2 (µatm)
404 (µatm)
∆ - 15 (µatm)
∆ - 23 (µatm)
∆ - 30 (µatm)
∆ - 34 (µatm)
∆ - 45 (µatm)
Date (UTC)
Atmospheric (µatm)
Draw Down
Figure 9.31
The decrease in the surface pCO 2 as a function of time in the southern patch.