

380
Chemical Oceanography, 4th Edition
The OUR measurement of Jenkins (1982) using the 3 H/ 3 He ratio gave primary production rates in the North Atlantic of 4.5 mol C m –2 yr –1 or 55 g C m –2 yr –1 . If this represents 80
to 90% of the amount being produced, the amount of primary productivity would be at
least 60 g C m –2 yr –1 . This is a lot higher than the expected values for open oceans.
9.1.8 remote Sensing Techniques
Current estimates of global production are biased by sampling errors. The tracer techniques integrate over seasonal to annual time scales, while the 14 C and O 2 techniques are
short in duration (hours). Recent work indicates that the oceans are perturbed over short
time scales, which can result in large transients in the carbon fixation. The distributions of
phytoplankton revealed from ships are quite scattered and poorly sampled. Since photosynthesis depends on chlorophyll, the concentration of chlorophyll in seawater can be
taken as an index of photosynthetic potential. This method is approximate since it is hard
to distinguish between active and inactive chlorophyll in dead material. This has led to
the development of remote sensing methods to estimate the pigment biomass (Gordon
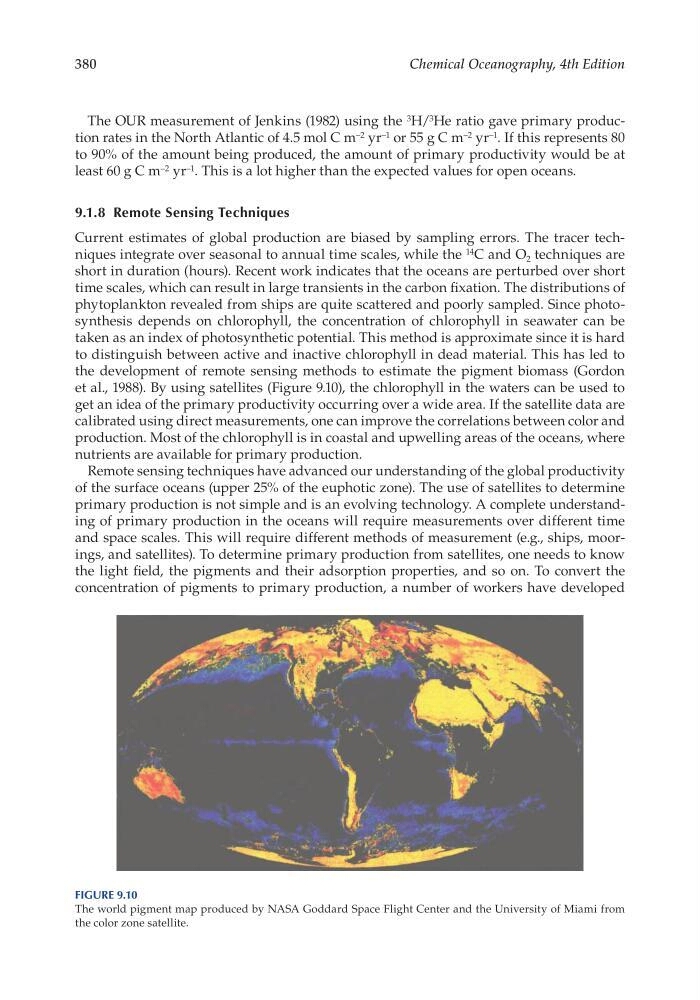
et al., 1988). By using satellites (Figure 9.10), the chlorophyll in the waters can be used to
get an idea of the primary productivity occurring over a wide area. If the satellite data are
calibrated using direct measurements, one can improve the correlations between color and
production. Most of the chlorophyll is in coastal and upwelling areas of the oceans, where
nutrients are available for primary production.
Remote sensing techniques have advanced our understanding of the global productivity
of the surface oceans (upper 25% of the euphotic zone). The use of satellites to determine
primary production is not simple and is an evolving technology. A complete understanding of primary production in the oceans will require measurements over different time
and space scales. This will require different methods of measurement (e.g., ships, moorings, and satellites). To determine primary production from satellites, one needs to know
the light field, the pigments and their adsorption properties, and so on. To convert the
concentration of pigments to primary production, a number of workers have developed
Figure 9.10
The world pigment map produced by NASA Goddard Space Flight Center and the University of Miami from
the color zone satellite.
Chemical Oceanography, 4th Edition
The OUR measurement of Jenkins (1982) using the 3 H/ 3 He ratio gave primary production rates in the North Atlantic of 4.5 mol C m –2 yr –1 or 55 g C m –2 yr –1 . If this represents 80
to 90% of the amount being produced, the amount of primary productivity would be at
least 60 g C m –2 yr –1 . This is a lot higher than the expected values for open oceans.
9.1.8 remote Sensing Techniques
Current estimates of global production are biased by sampling errors. The tracer techniques integrate over seasonal to annual time scales, while the 14 C and O 2 techniques are
short in duration (hours). Recent work indicates that the oceans are perturbed over short
time scales, which can result in large transients in the carbon fixation. The distributions of
phytoplankton revealed from ships are quite scattered and poorly sampled. Since photosynthesis depends on chlorophyll, the concentration of chlorophyll in seawater can be
taken as an index of photosynthetic potential. This method is approximate since it is hard
to distinguish between active and inactive chlorophyll in dead material. This has led to
the development of remote sensing methods to estimate the pigment biomass (Gordon
et al., 1988). By using satellites (Figure 9.10), the chlorophyll in the waters can be used to
get an idea of the primary productivity occurring over a wide area. If the satellite data are
calibrated using direct measurements, one can improve the correlations between color and
production. Most of the chlorophyll is in coastal and upwelling areas of the oceans, where
nutrients are available for primary production.
Remote sensing techniques have advanced our understanding of the global productivity
of the surface oceans (upper 25% of the euphotic zone). The use of satellites to determine
primary production is not simple and is an evolving technology. A complete understanding of primary production in the oceans will require measurements over different time
and space scales. This will require different methods of measurement (e.g., ships, moorings, and satellites). To determine primary production from satellites, one needs to know
the light field, the pigments and their adsorption properties, and so on. To convert the
concentration of pigments to primary production, a number of workers have developed
Figure 9.10
The world pigment map produced by NASA Goddard Space Flight Center and the University of Miami from
the color zone satellite.