

379
Primary Production in the Oceans
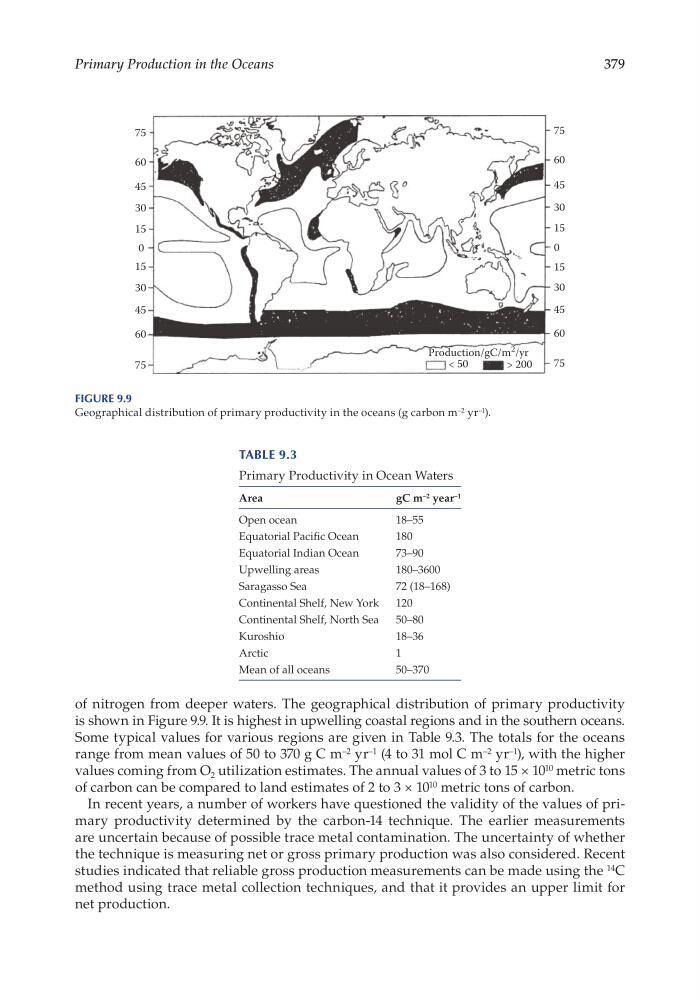
of nitrogen from deeper waters. The geographical distribution of primary productivity
is shown in Figure 9.9. It is highest in upwelling coastal regions and in the southern oceans.
Some typical values for various regions are given in Table 9.3. The totals for the oceans
range from mean values of 50 to 370 g C m –2 yr –1 (4 to 31 mol C m –2 yr –1 ), with the higher
values coming from O 2 utilization estimates. The annual values of 3 to 15 × 10 10 metric tons
of carbon can be compared to land estimates of 2 to 3 × 10 10 metric tons of carbon.
In recent years, a number of workers have questioned the validity of the values of primary productivity determined by the carbon-14 technique. The earlier measurements
are uncertain because of possible trace metal contamination. The uncertainty of whether
the technique is measuring net or gross primary production was also considered. Recent
studies indicated that reliable gross production measurements can be made using the 14 C
method using trace metal collection techniques, and that it provides an upper limit for
net production.
75
Production/gC/m
2 /yr
< 50
> 200
75
60
60
45
45
30
30
15
15
0
75
75
60
60
45
45
30
30
15
15
0
Figure 9.9
Geographical distribution of primary productivity in the oceans (g carbon m –2 yr –1 ).
Table 9.3
Primary Productivity in Ocean Waters
Area
gC m –2 year –1
Open ocean
18–55
Equatorial Pacific Ocean
180
Equatorial Indian Ocean
73–90
Upwelling areas
180–3600
Saragasso Sea
72 (18–168)
Continental Shelf, New York
120
Continental Shelf, North Sea
50–80
Kuroshio
18–36
Arctic
1
Mean of all oceans
50–370
Primary Production in the Oceans
of nitrogen from deeper waters. The geographical distribution of primary productivity
is shown in Figure 9.9. It is highest in upwelling coastal regions and in the southern oceans.
Some typical values for various regions are given in Table 9.3. The totals for the oceans
range from mean values of 50 to 370 g C m –2 yr –1 (4 to 31 mol C m –2 yr –1 ), with the higher
values coming from O 2 utilization estimates. The annual values of 3 to 15 × 10 10 metric tons
of carbon can be compared to land estimates of 2 to 3 × 10 10 metric tons of carbon.
In recent years, a number of workers have questioned the validity of the values of primary productivity determined by the carbon-14 technique. The earlier measurements
are uncertain because of possible trace metal contamination. The uncertainty of whether
the technique is measuring net or gross primary production was also considered. Recent
studies indicated that reliable gross production measurements can be made using the 14 C
method using trace metal collection techniques, and that it provides an upper limit for
net production.
75
Production/gC/m
2 /yr
< 50
> 200
75
60
60
45
45
30
30
15
15
0
75
75
60
60
45
45
30
30
15
15
0
Figure 9.9
Geographical distribution of primary productivity in the oceans (g carbon m –2 yr –1 ).
Table 9.3
Primary Productivity in Ocean Waters
Area
gC m –2 year –1
Open ocean
18–55
Equatorial Pacific Ocean
180
Equatorial Indian Ocean
73–90
Upwelling areas
180–3600
Saragasso Sea
72 (18–168)
Continental Shelf, New York
120
Continental Shelf, North Sea
50–80
Kuroshio
18–36
Arctic
1
Mean of all oceans
50–370