

341
Micronutrients in the Oceans
in photosynthesis and other processes in plants. Absorption and conversion to organic P
compounds proceed even in the dark. Above a concentration of 0.3 μM, the rate of growth
of many species of phytoplankton is independent of the concentration of P. Below 0.3 μM,
cell division becomes inhibited, and P- deficient cells are produced. This probably does not
occur in the oceans since NO 3
– is usually exhausted before PO 4
3– falls to a critical level.
When phytoplankton die, the organic P is rapidly converted to PO 4
3– . Much of the phytoplankton is consumed by zooplankton, which obtain PO 4
3– in the process. The unassimilated material is lost in fecal pellets, which contain appreciable amounts of organic P.
Hydrolysis of organic P occurs rapidly through the action of phosphorylases. The excretion of P by zooplankton is minimal when phytoplankton are abundant and maximal
when phytoplankton are not abundant. The low rate of excretion when food is abundant
arises because phospholipids are being stored or used for egg production. When food is
scarce, these trends are reversed, and P is excreted.
Typical profiles of total and inorganic P in the English Channel are shown in Figure 8.3.
In the summer, nearly 50% of the P in surface waters is organic. In deeper waters, most of
the P is in an inorganic form. In the winter, almost all the P is inorganic. The variations
in coastal waters are the result of upwelling and phytoplankton blooms. Surface mixing
in the winter can cause linear profiles of P in nearshore waters. After spring and summer
blooms, the PO 4
3– is decreased considerably. In the Chesapeake Bay, phosphate decreases
from 0.4 to 0.1 μM can occur at 3:00 p.m. After sunset, the values rapidly increase to a
maximum at 2:00 a.m.
Typical profiles of PO 3
3– in the Atlantic and Pacific (from World Ocean Circulation
Experiment [WOCE] measurements) are shown in Figure 8.4. The surface values are nearly
Bacteria
Organic Phosphorus
in Plants
Dissolved Organic
Phosphate
Organic Phosphorus
in Animals
Dissolved Inorganic
Phosphate
Guano and Other
Animal Feces
Inorganic Phosphate
Muds
Detrital Organic
Phosphate
Organic Phosphate
Muds
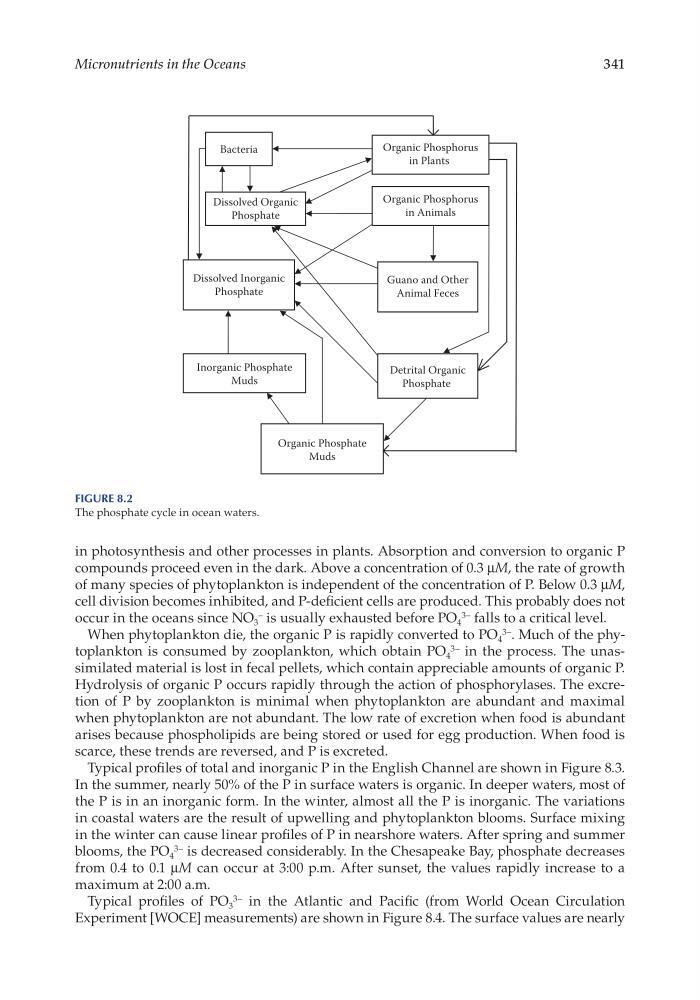
Figure 8.2
The phosphate cycle in ocean waters.
Micronutrients in the Oceans
in photosynthesis and other processes in plants. Absorption and conversion to organic P
compounds proceed even in the dark. Above a concentration of 0.3 μM, the rate of growth
of many species of phytoplankton is independent of the concentration of P. Below 0.3 μM,
cell division becomes inhibited, and P- deficient cells are produced. This probably does not
occur in the oceans since NO 3
– is usually exhausted before PO 4
3– falls to a critical level.
When phytoplankton die, the organic P is rapidly converted to PO 4
3– . Much of the phytoplankton is consumed by zooplankton, which obtain PO 4
3– in the process. The unassimilated material is lost in fecal pellets, which contain appreciable amounts of organic P.
Hydrolysis of organic P occurs rapidly through the action of phosphorylases. The excretion of P by zooplankton is minimal when phytoplankton are abundant and maximal
when phytoplankton are not abundant. The low rate of excretion when food is abundant
arises because phospholipids are being stored or used for egg production. When food is
scarce, these trends are reversed, and P is excreted.
Typical profiles of total and inorganic P in the English Channel are shown in Figure 8.3.
In the summer, nearly 50% of the P in surface waters is organic. In deeper waters, most of
the P is in an inorganic form. In the winter, almost all the P is inorganic. The variations
in coastal waters are the result of upwelling and phytoplankton blooms. Surface mixing
in the winter can cause linear profiles of P in nearshore waters. After spring and summer
blooms, the PO 4
3– is decreased considerably. In the Chesapeake Bay, phosphate decreases
from 0.4 to 0.1 μM can occur at 3:00 p.m. After sunset, the values rapidly increase to a
maximum at 2:00 a.m.
Typical profiles of PO 3
3– in the Atlantic and Pacific (from World Ocean Circulation
Experiment [WOCE] measurements) are shown in Figure 8.4. The surface values are nearly
Bacteria
Organic Phosphorus
in Plants
Dissolved Organic
Phosphate
Organic Phosphorus
in Animals
Dissolved Inorganic
Phosphate
Guano and Other
Animal Feces
Inorganic Phosphate
Muds
Detrital Organic
Phosphate
Organic Phosphate
Muds
Figure 8.2
The phosphate cycle in ocean waters.